Full Report
Fit
Does not fit the framework (P1 not met); contested: X2, P4a
Charter clears the universe screen and shows a genuine, dated dislocation — a 70.6% fall on heavy volume — but it fails the framework's one pure gate. Year-10 durability (P1) is not met by all four jurors: revenue turned negative for the first time in the series and the broadband unit base is eroding, so "very high conviction" that year-10 revenue and adjusted free cash flow will be higher cannot be reached. Verdict: Does not fit the framework. Confidence is low — the diagnosis probability spread is wide and the name-masked juror flipped its read on two gate criteria. Flags: structural-decline exclusion (X3) hit; prior-driven-risk raised; X2 and P4a contested. Not watchlist-only.
Universe and exclusions — unsoftened
Universe: cleared. Charter's Class A stock trades on the NASDAQ Global Select Market as CHTR [1], a U.S.-domiciled broadband and cable operator across 41 states [2] — no China-company or ADR disqualifier (U1 met, 4–0). USD market capitalization is $17.80B ($129.22 on 2026-07-22 across 137,743,676 shares), above the $10B scale line, though it clears by only 1.78x after the drawdown, and the equity is a thin sliver of a ~$112B enterprise value carrying $94.3B of net debt (U2 met, 4–0).
Exclusions — one hit.
- X3 Structural decline — HIT (3–1, cross-family split). Charter's own FY2025 10-K names the mechanism: fiber-to-the-home overbuild from AT and T (~27% of footprint) and Verizon (~16%), plus 5G/LTE fixed-wireless home internet from national carriers [3]. Internet customers fell 464,000 year-over-year to 29.56M (Mar-2026), quarterly losses roughly doubled to 120,000, and penetration of passings slid from 56.3% to 54.0% on a footprint that itself grew 2.7% — share loss, not saturation [4]. The one juror who dissented weighed the still-shallow revenue print (−0.56%, one year) against the structural sourcing; this exclusion overlaps the P5 diagnosis and is where the temporary-vs-permanent question is joined.
- X1 Auto OEM — clear (4–0). 100% of revenue is connectivity, cable, and mobile [5]; the auto exclusion is not triggered.
- X4 Consensus-saturated story — clear (4–0). Charter trades at ~0.32x sales with a ~24.8% trailing FCF yield after a 70.6% fall — a beaten-down value name, the opposite of an extreme-multiple growth narrative.
- X2 Promotion pattern — CONTESTED (2–2, cross-family split). Treated in Self-Help below.
- S1 China dependence — clear (4–0). No China revenue or asset exposure; the footprint is entirely U.S.
Pattern match
Of the reader contract's four setups, Charter most resembles the fourth — a large infrastructure duopoly on a fear dip — by structure: an essential broadband network, 30-plus-year history, the peer set's widest operating margin (23.6%) [6], and a dislocation off a specific event. But that pattern requires the fear to be specific, testable, and temporary — a threat that mean-reverts. Here the threat is a named, industry-wide substitution (fiber and fixed-wireless) that the same forces are inflicting on Altice and Comcast, and the diagnosis of whether it mean-reverts is a near coin-flip (P5 p_temporary 0.55). It is not the cyclical-bank setup (no macro-loss-rate mispricing), not the dividend setup (no dividend), and not the insurance forecasting-error setup (no one-year cost-trend miss that reprices). The honest read: it wears the shape of the quality-duopoly pattern but fails the pattern's temporariness check, which is exactly what the gate and the exclusion register.
The pillar ledger
Year-10 durability — the gate (P1: not met, 4–0; p_year10 0.51, spread 0.10)
The gate decides the verdict. Reference line: year-10 revenue and adjusted FCF higher than today, with very high conviction — any proper doubt resolves to not met.
- Top line has rolled over. Revenue rose every year to a $55.085B peak (FY2024) before slipping −0.56% to $54.774B (FY2025) — the first annual decline in the series. The mechanical three-year high-single-digit-decline disqualifier is false (one decline year), but the base is shrinking underneath the plateau: customer relationships fell from 32.16M to 31.68M and penetration from 56.3% to 54.0% [7].
- FCF has roughly halved. Reported free cash flow fell from an $8.604B peak (FY2021) to $4.418B (FY2025) under decade-high capex (~21.3% of revenue) and a ~$5.45B annual interest wedge, and $669M of the $747M FY2025 uptick was one-off cash-tax timing from restored bonus depreciation, not operations [8]. Adjusted FCF on the playbook basis is not computable (SBC absent from the feed), so the gate is judged on the reported proxy.
- Strongest counter-fact. Management guides capex to peak and fall to 13–14% of revenue by 2028 [9], which mechanically frees several billion of FCF if the build finishes and subscriber trends stabilize — a genuine path to a higher year-10 FCF. But it is forward guidance from a team that missed the prior capex-fade, and the durability of a rising FCF is not underwritten by the record. Full treatment: The Broadband Incumbent.
FCF consistency (P2: cannot determine — split a not_met / b met / c,d cannot_determine)
The deterministic adjusted-FCF stability metric is not computable: SBC is missing for all ten fiscal years, so no complete five-year adjusted window exists. On the raw FCF series the rolling five-year average sits in a tight $4.07B–$5.83B band (CV 0.11), but that smoothing hides an annual series with CV 0.42 and a 3.26x peak-to-trough spread, and the most recent three years average only $3.63B — below every rolling window. The missing datapoint is stated plainly in Contested and undetermined below. Charter has never posted a negative FCF year, so the criterion's cyclical-negative-episode test is not the operative failure mode; the question is whether the capex-cycle trough mean-reverts or resets to a lower base. Full treatment: The Broadband Fulcrum.
Dislocation (P3a, P3b: met) + Yield vs bar (P3c: not met; P3d: met)
A real, dated dislocation. An identifiable adverse event exists (P3a met, 4–0): the April 24, 2026 print, Internet losses doubling to 120,000, drove a 25.5% single-day fall on 11.9x median volume [10]. Volume clears the reference line (P3b met, 4–0) at 3.88x on the 20-day measure. The counter-fact sits in the same breath: consensus FY2027 EPS was cut from $47.37 to $44.67 over the same window, so price and estimates fell together — a durability repricing as much as a fear spike — and the 70.6% grind ran 402 days from a merger-announcement peak, punctuated by a +7.6% relief rally, rather than one clean capitulation.
Yield is below the bar (P3c: not met, 4–0). Net debt / Adjusted EBITDA of 4.15x ($94.28B / $22.708B) classifies Charter as levered, setting the 25% reference bar [11].
Source: adjusted FCF (FCF minus SBC minus 5y-avg acquisitions) derived from reported financials, SBC per the FY2025 10-K [12] and FY2024 10-K [13]; yield on $17.80B market cap.
Current adjusted FCF yield of 21.0% ($3,745M / $17,799M) sits 396 bps below the 25% bar — outside the 150-bps lean-fit window — and the three-year average of 16.6% is 837 bps below it. The current reading is flattered by the reversible tax-timing benefit; the three-year average is depressed by trough-capex years, so neither number is clean.
Forward path clears — on one variable (P3d: met, 4–0; p_forward_bar 0.625, spread 0.03). Consensus-adjusted forward yield crosses 25% by FY2027 (~30.6%) without relying on beyond-consensus mean reversion [14]. The entire lift comes from capex fading toward $8B against roughly flat Adjusted EBITDA — and the pending Cox merger, which would issue ~179M as-converted shares and lower the leverage target, is not in the standalone consensus [15]. Full treatment: The Clock and the Price and The Broadband Fulcrum.
Balance sheet + Self-Help (P4a: contested; P4b: met; P4c: n/a; X2: contested)
Can it outlast the problem? Contested (P4a, 2–2, cross-family split). Near-dated maturities are small and refinanceable — $1.06B due 2026, $3.56B in 2027 against ~$4.9B of cash plus revolver — but the schedule builds to a $13.87B wall in 2030, and 2026 cash interest of ~$4.82B already absorbs ~96% of company-defined FCF [16]. Two jurors read the maturity ladder and revolver access as comfortable headroom; two read the post-close move to a 3.5–3.75x leverage target as capital allocation competing with buybacks at the moment repurchases matter most [17]. The counter to the bear read: management delevers by growing EBITDA into a fixed leverage band, not by diverting FCF to forced paydown.
Repurchase engine is real (P4b: met, 4–0). Buybacks are executed on the cash-flow statement — ~$71B cumulative — and shares fell from 234.8M (FY2016) to 137.7M (FY2025), a 5-year CAGR of −8.0% with the trend flag not rising [18]. Counter-fact in the same breath: the program was throttled 92% during the capex peak, much of it was executed at $225–$384 versus ~$129 today, and the equity-funded Cox merger would issue ~179M as-converted shares, inflecting the count upward at close [19]. P4c (dividend cover) is not applicable — Charter pays no dividend; the return case is entirely buyback and FCF.
X2 promotion pattern — CONTESTED (2–2, cross-family split). Prong one is evidenced: the Q2-2023 pledge that capex/revenue would fall "below 2022 levels" after the network build finished [20] instead saw FY2025 capex reach a five-year-high 21.3% of revenue, recast to "13–14% by 2028." Prong two: insiders own just 1.10% of the class, and CEO pay is option-dominated (a $23M/yr grant-value option stack on a $2.5M salary) [21] — insider beneficial-ownership figures are drawn from the 2026 proxy, whose PDF is not in the citable corpus. Two jurors registered the pattern; two weighed the counter — the controllable commitments were delivered (rural passings 483k vs a 450k target; video losses cut from −408k to −60k) and the CFO openly conceded the price embeds negative perpetuity-growth, which reads as candor, not promotion. Full treatment: Buybacks to a Handover.
Diagnosis (P5: met; p_temporary 0.55, spread 0.16 — carried from the trial)
The impairment's diagnosis is the contested heart of the case, resolved by the adversarial trial and carried into the jury at p_temporary 0.55 — a near coin-flip. The temporary case: the FCF depression is capex timing, with spend guided from ~$11.7B (2025) to under $8B (2028) on roughly flat EBITDA, lifting FCF toward a 28–41% forward yield and worth "over $28 of free cash flow per share" [22]. The permanent case: internet customers, penetration, and ARPU are all falling on a growing footprint, and FY2025 revenue turned negative — a structural competitive reset. The strongest counter to the permanent read is that realized damage is modest so far (Q1'26 Adjusted EBITDA only −2.2% YoY), so the 70% equity move runs well ahead of the earnings impairment booked to date. The trial's three judges returned 0.57 / 0.41 / 0.55, an order-stability gap of 0.09; the tally records it not contested at the trial level but the wide jury spread (0.16) is what pins confidence low. Full treatment: The Broadband Fulcrum and Scale Without Pricing Power.
Instrument context (I1: not verifiable)
Long-dated listed options exist — LEAPS to January 2027 and January 2028 (beyond the 18-month target) on an actively traded chain — and implied volatility is elevated (a 33–83 52-week range, trading near the top). Both readings come from dated third-party web sources rather than an exchange primary feed, so the criterion is recorded not verifiable (4–0). It drives only the watchlist overlay and never blocks a pillar verdict; because the overall verdict is not fits/lean_fit, the watchlist-only overlay does not apply. Full treatment: The Clock and the Price.
What a 3x-in-3-years would require
The framework's target test prices the equity at the applicable bar-yield on normalized adjusted FCF and asks what consensus would have to concede. For Charter that arithmetic is not computable in this run, and the tally records it as such:
Re-rating math unavailable because the applicable bar or normalized adjusted FCF is missing.
The inputs are absent for a specific, honest reason: adjusted FCF (FCF minus SBC minus trailing-5y acquisitions) is not computable because stock-based compensation is missing from the cash-flow feed for every year, and balance_sheet_class came back "unknown" because EBITDA was absent from the feature's input — so the balance-sheet-scaled bar and the normalized FCF base cannot both be struck deterministically. What can be said in reference terms: the current 21.0% adjusted yield sits 396 bps under the 25% levered bar, and closing that gap to a re-rating relies on the same single variable the forward path does — the guided capex roll-off landing on flat EBITDA. The base-rate context for how far infrastructure-duopoly dislocations have historically re-rated is developed against the drawdown episodes in The Clock and the Price. No target, price, or return is asserted here.
Contested and undetermined
Contested (both readings recorded, split 2–2 across model families):
- X2 — Promotion pattern. Two jurors (one family) read no hit: the controllable operational commitments were delivered and the CFO's negative-perpetuity-growth candor reads as forthright. Two jurors (the other family) read a hit: a repeated forward-guidance miss plus weak insider economic ownership (1.10% of class; option-dominated pay) is the promotion signature. The name-masked juror resolved to not_met.
- P4a — Outlast + allocation headroom. Two jurors read the small near maturities, revolver access, and proven refinancing as comfortable headroom (met). Two read the post-close 3.5–3.75x leverage target and the shared claim on freed FCF as allocation pivoting toward deleveraging exactly when repurchases matter (not_met). The masked juror resolved to not_met.
Undetermined (P2 — FCF consistency, cannot determine). The named missing datapoint, from the jurors:
- complete adjusted FCF/SBC history for rolling five-year adjusted FCF stability
- five consecutive years of adjusted FCF, including SBC, to compute rolling adjusted FCF stability
Provenance
Source: fit tally and jury records for this run (deterministic aggregation).
Two model families sat four voting seats plus a name-masked probe. The verdict was pressed hard: the P1 gate held unanimously across both families, but the diagnosis spread is wide (0.16), one skeptic finding was refuted and two weakened, and — most tellingly — the name-masked juror flipped its read on X2 and X3 when the company's identity was hidden, which raised the prior-driven-risk flag and, with the wide P5 spread, sets confidence to low.
The falsifier ledger
These are the standing what-would-change-this conditions. Several carry an explicit direction (toward temporary or toward permanent) and a dated window; they are reproduced verbatim.
Data gaps
- Adjusted FCF is not computable across all years — stock-based compensation is missing from the cash-flow feed, so the playbook's adjusted-FCF (FCF minus SBC minus 5y-avg acquisitions) cannot be formed; P1, P2, and the yield pillar work from reported FCF ($4.418B FY2025) as a proxy, with SBC reconstructed from primary 10-K reconciliations where used.
balance_sheet_classreturned "unknown" — EBITDA was absent from the feature input, so net-debt/EBITDA and the balance-sheet-scaled bar were reconstructed as levered (4.15x) from Adjusted EBITDA of $22,708M on the 10-K, a company-defined non-GAAP measure.- Year-10 durability (P1) cannot be resolved to high conviction from the corpus — it hinges on whether the capex build genuinely peaks and falls to the 13–14%-of-revenue guide versus continued subscriber and penetration erosion; a contested forward path, not a settled fact.
- P5 relies on a capex-fade forecast that cannot be verified historically, and forward Adjusted-EBITDA consensus by year is not in the feature file; the flat-EBITDA temporary case is sourced from the estimates feed and should be re-verified before it is treated as consensus-backed.
- No implied-volatility primary feed exists and the run's web-search credit was exhausted, so I1's IV and long-dated option figures come from a single dated third-party source, not an exchange/OPRA feed.
- The Cox/Liberty pro-forma is only partially captured — the pending merger's pro-forma share count, assumed debt (~$12B referenced), combined FCF base, and covenant impact are not reflected in the standalone consensus and could not be re-priced line-by-line from the corpus.
- The drawdown gauge peak ($427.25, 2025-05-16) is a recent local high, not the all-time high — the ATH close was $821.01 (2021-09-02), so the fall from the true ATH is ~84% versus the gauge's 70.6% from the merger-day peak; the gauge is used as source of record per contract.
Checked and unremarkable
All eight synthesis scouts — accounting and cash quality, business economics, capital allocation, competition and moat, history and track record, industry, people and governance, and valuation and expectations — returned load-bearing findings rather than routine or empty ones; each is folded into the pillar treatments above and the underlying chapters. Nothing was checked and set aside as immaterial.
Playbook version
Playbook fcf-dislocation, version 1.
The Broadband Incumbent
Charter Communications is the second-largest cable operator in the United States, selling internet, mobile, video, and phone service under the Spectrum brand to a network that reaches roughly 58 million homes and businesses across 41 states [1]. It is a business built on a single asset — a wire running past tens of millions of front doors — and it is worth understanding why a company that large, that entrenched, and that profitable has seen its stock fall 71.6% from its three-year high, more than double the decline of the typical large communications peer.
This chapter sets the scene: what Charter actually sells, how the cable industry makes money, the three structural forces reshaping it, and why the company is in front of an investor right now.
What Charter Sells
A cable operator — the industry calls itself a multiple-system operator, or MSO — owns a physical network that passes homes and businesses. The count of locations that network can reach is its passings; the count of customers actually buying at least one service is its customer relationships; the ratio of the two is penetration. At the end of 2025 Charter's network passed 58.4 million locations, held 31.8 million customer relationships, and so penetrated 54.5% of what it passed — down from 56.7% a year earlier [2].
Onto that one network Charter sells four products, bundled to save the customer money and, not incidentally, to make leaving harder [3]. The hero numbers show where the weight sits.
Homes/Businesses Passed (M)
Internet Customers (M)
Video Customers (M)
Mobile Lines (M)
Source: Q1 FY2026 earnings release, Summary of Operating Statistics (as of December 31, 2025) [4].
Internet is the product that matters. Charter serves 29.7 million internet customers, roughly two and a half times its 12.6 million video customers, and broadband is where the margins live. Mobile — 11.8 million lines and climbing — is not a network Charter built: Spectrum Mobile resells the cellular network of Verizon under a wholesale arrangement (a mobile virtual network operator, or MVNO), so Charter can offer a phone plan without owning a tower [5]. Video and voice are legacy products in managed decline. The bundle is the strategy; broadband is the engine.
Where the Money Pools
Cable is a fixed-cost business. The expensive part — burying and stringing the network — is already spent, so each additional customer on an existing line arrives at high incremental margin, and each customer lost takes that margin with it. That economics shows up in Charter's operating margin of 23.6% in FY2025, the widest among the large operators it competes with — wider than Comcast's 16.7%, Verizon's 21.2%, and T-Mobile's 20.7%. But scale and margin have not bought growth: in FY2025 Charter's revenue fell 0.6% — its first annual decline — while the median large peer grew 2.5%.
Source: derived from reported financials, FY2025 company and peer filings; price drawdown from market data as of July 22, 2026.
The scoreboard captures the puzzle this report unpacks. Charter earns the best operating margin of the group, spends by far the most on its network (21.3% of revenue against a 10.4% peer median), converts the least of its revenue into free cash flow (8.1% against 19.0%), and its stock has fallen the hardest. Whether that combination reflects a moat that is quietly leaking or a spending cycle about to end is the argument of the chapters that follow (Scale Without Pricing Power, The Broadband Fulcrum).
Three Axes of Change
Charter operates in an industry changing on three fronts at once — the demand for its core product, the capacity it must build to defend that product, and the consolidation of the operators themselves. Each is worth taking in turn, because the rest of the report assumes the reader carries this map.
Demand: fiber and fixed wireless
For two decades cable faced only weak competition for home broadband — the phone companies' copper DSL lines were slower, and little else reached the home. That is over. Charter now names two attackers in its own filing. The first is fiber-to-the-home (FTTH), where a telco runs a glass fiber the whole way to the house and matches or beats cable's speeds; AT&T and Verizon overlap roughly 27% and 16% of Charter's footprint respectively [6]. The second is fixed wireless access (FWA), where a mobile carrier sells home internet delivered over its 5G cellular network, using spare wireless capacity rather than building any new wire to the home [7].
These are not one company's excuses. Cable's rivals describe the same threat independently. Altice USA lists "T-Mobile fixed wireless, Verizon fixed wireless and AT&T Internet Air" as its primary wireless broadband competitors [8]. Comcast — the largest US cable operator, bigger than Charter — reported losing 181,000 broadband customers in a single quarter to what it called "continued competitive intensity," with broadband pricing decelerating alongside [9]. When the two scale leaders and a mid-sized operator all report the same wound, it is a property of the industry, not of one management team.
The effect is visible in Charter's own units: internet customers slipped to 29.68 million at the end of 2025 from 30.02 million a year earlier, and penetration of passings fell 1.8 points [10]. A policy change layered on top: the federal Affordable Connectivity Program, a monthly broadband subsidy for low-income households, expired in the second quarter of 2024, and both Charter and Comcast tie a slice of their disconnects to its end [11].
The industry's answer to a weakening standalone-broadband product is convergence — selling mobile and broadband together to hold the customer. Charter is adding mobile lines at pace; Verizon's chief executive calls convergence "one of our key vectors of growth" and notes that churn is "almost 30% less on converged offers" [12]. How well that weapon works for Charter, and what it costs in price, is taken up later (Scale Without Pricing Power).
Capacity: the DOCSIS 4.0 build
Charter's network is not all-fiber. Its last mile is hybrid fiber-coaxial (HFC) — fiber from the headend to a neighborhood node, then the older coaxial cable the final stretch into the home [13]. Coax is cheaper to upgrade than to replace, and that is the incumbent's advantage: rather than rebuild in fiber to answer the overbuilders, Charter is running a network evolution that expands the coax's usable spectrum to 1.2 GHz and then 1.8 GHz and layers on the next modem standard, DOCSIS 4.0, to deliver the symmetrical multi-gigabit speeds fiber offers — at a fraction of a full rebuild's cost [14].
Cheaper than a rebuild is not cheap. Capital spending reached 21.3% of revenue in FY2025 — roughly double the peer median — and on top of the upgrade Charter is running a subsidized rural-construction initiative, having spent $7.7 billion since 2022 to extend its network to unserved areas and expecting to invest over $8 billion in total, partly offset by more than $2 billion of federal support awarded through the Rural Digital Opportunity Fund [15]. The tension is plain and it defines the story: Charter is spending the industry's heaviest capital budget to defend a subscriber base that is shrinking anyway, while fixed-wireless rivals add customers by reusing wireless capacity they already own.
Source: derived from reported financials, FY2021–FY2025 (the peer median capex intensity was 10.4% in FY2025).
The company expects this build to be largely complete by the end of 2027, which would make the capex line above a curve rather than a staircase — a potential inflection the market has been promised and has not yet seen [16]. That promise, and its track record, is the subject of the closing chapter (The Clock and the Price).
Consolidation: the Cox combination
The third change is to the operators themselves. In May 2025 Charter agreed to combine with Cox Communications, the largest privately held US cable operator, in a deal valuing Cox at an enterprise value of roughly $34.5 billion [17]. The price was struck at 6.44 times Cox's estimated 2025 EBITDA — the same multiple the market was then paying for Charter — and the combined company will assume roughly $12 billion of Cox debt [18].
The deal reshapes control as much as scale. Cox Enterprises — the founding family's holding company — will own approximately 23% of the combined entity, its chairman will take the board chair, and within a year the company will rename itself Cox Communications, keeping Spectrum only as the consumer-facing brand [19]. It follows a separate combination with Liberty Broadband, one of Charter's long-standing controlling holders, whose governance rights fall away as Cox's arrive [20]. How Charter arrived at a family handover after a decade of a very different capital strategy is its own chapter (Buybacks to a Handover); for now it is enough to see that scale consolidation is the industry's bet that bigger survives, placed at the same moment the fixed-line core it is built around is eroding.
Video and the Regulatory Backdrop
Two features of the operating environment round out the scene. The first is video, the product cable was born to sell and is now managing toward the exit. Charter's video customers have fallen from 16.2 million at the end of 2020 [21] to 12.6 million at the end of 2025, even as internet and mobile moved the other way — the clearest single picture of what the business is becoming [22].
Sources: FY2021 Annual Report, Operating Statistics [23]; Q1 FY2026 earnings release, Summary of Operating Statistics [24]; intervening figures from the FY2023–FY2024 Annual Reports.
Video shrinks partly because it is a squeezed product. Media consolidation has "resulted in fewer suppliers and additional selling power on the part of programming suppliers," so the fees Charter pays for channels keep rising while customers leave for streaming; Charter's counter is to fold the programmers' own streaming apps into its video packages, which protects the subscriber but not the margin [25]. Average monthly revenue per residential customer fell to $117.19 at the end of 2025 from $118.65 a year earlier as the mix tilted away from high-priced video bundles [26]. The money is leaving video and pooling in broadband — which is exactly why the erosion of broadband matters so much.
The second feature is regulation, which for a cable operator is federal and mostly runs through the Federal Communications Commission. It sets the terms on which Charter attaches its lines to utility poles it does not own, a direct cost input [27]. It periodically reclassifies broadband between a lightly regulated "information service" and a common-carrier "telecommunications service," the net-neutrality cycle that has swung back and forth for a decade [28]. And it channels the subsidies that make rural construction pay — the RDOF and the newer Broadband Equity, Access and Deployment (BEAD) program — whose continuity Charter itself flags as uncertain [29]; the ACP, an earlier low-income subsidy, has already shown that a program's expiration can subtract customers [30]. Policy is both a cost and a demand lever, and it moves.
Why This Is Interesting Now
The reason to look at Charter today is the price. On July 22, 2026 the stock sat 71.6% below its trailing three-year high, against a peer median drawdown of 30.0% — a de-rating more than twice as deep as its industry, and steeper than every listed peer except the far smaller Cable One. A scale leader with the best operating margin in its peer set has been re-rated as if something more than an industry-wide slowdown were wrong.
Source: market data as of July 22, 2026, company and peer price histories.
That gap frames the report. Charter is the scale leader of a shrinking business — a heavily indebted cable incumbent whose profits come almost entirely from one product, fixed-line broadband, now eroding on three fronts at once: fiber overbuild, fixed wireless, and the long melt of video. After a decade of retiring its own shares with borrowed money, it is reversing course into an equity-funded combination with Cox that enlarges the share count and hands the chairmanship to a new controlling family. What remains for a public shareholder is a thin, heavily levered slice of a very large enterprise, and the market now prices that slice as a wager on whether the network build that has consumed cash for years finally ends — and under whose control. The chapters that follow trace how the money is made (The Broadband Fulcrum), whether the moat holds (Scale Without Pricing Power), who now steers the capital (Buybacks to a Handover), and what the price is counting on (The Clock and the Price).
The Broadband Fulcrum
The Broadband Incumbent left the reader with a company of scale — 58.4 million passings, 31.8 million customer relationships, a four-product bundle — and a stock down 71.6% from its three-year high. This act is about the machine underneath that scale: how a dollar of Spectrum revenue is actually made, and how little of it survives the trip to free cash flow.
The short version is that almost the entire model now turns on one line. Residential Internet is where the pricing happens, where the margin pools, and where the whole business is either defended or lost. Everything else — a melting video product, a fast-scaling mobile business, a stable commercial book — either feeds that line or rides alongside it.
Revenue ($B, FY2025)
Adjusted EBITDA Margin
Operating Margin
Free Cash Flow Margin
Source: FY2025 Annual Report (Form 10-K), Adjusted EBITDA table [1]; margins and FCF margin derived from reported financials, FY2021–FY2025 [2].
A 41.5% Adjusted EBITDA margin and a 23.6% operating margin are both the widest in the peer group — and the 8.1% free-cash-flow margin is the narrowest. The distance between those two numbers is the subject of this chapter.
The line the model turns on
Charter groups its residential revenue into four service lines. In 2025, only one of the two large ones grew. Internet revenue rose 1.7% to $23.8 billion; mobile service jumped 22.0% to $3.8 billion; the two together, which management now brands "Connectivity," rose 4.1% to $27.5 billion. Against that, video fell 9.4% to $13.7 billion and voice fell 6.0% to $1.35 billion [3].
Source: FY2025 Annual Report (Form 10-K), MD&A revenues by service offering [4].
Internet is the line to watch because it carries the profit and because it is being priced against a base that no longer grows. The 10-K decomposes its residential-Internet revenue change into two forces that pull in opposite directions: rate and product mix added $785 million, while a lower average customer count subtracted $380 million, for a net gain of $405 million [5]. Behind the volume figure: residential Internet customers fell by 393,000 during the year, to 27.64 million, and total Internet customers fell to 29.68 million from 30.08 million [6].
Source: FY2025 Annual Report (Form 10-K), residential Internet revenue bridge [7].
This is the mechanism the model depends on: price beat volume by $405 million, so the line grew — but the margin of victory is thin and it is being won on rate, not units. Rate here means promotional roll-offs, list-price adjustments, and a favorable shift in how bundled revenue is allocated, not a headline price hike; monthly residential revenue per customer was essentially flat at $119.05, versus $118.71 a year earlier [8]. Flat per-customer revenue with a shrinking base is a model that grows only as long as rate keeps out-running attrition by a small margin each year. Whether it can, as fiber and fixed-wireless press on both the rate and the base, is a competitive question the next act takes up.
A growth core inside a shrinking top line
Total revenue fell 0.6% in 2025, to $54.77 billion from $55.09 billion — the first annual decline in the company's modern history, after growth had already decelerated from 7.5% in 2021 to 1.1% and 0.9% in the two prior years [9]. Read in isolation, a top line turning negative looks like the beginning of a contraction. Read against the service lines, it is something more specific: the growth core (connectivity, +4.1%) is now slightly smaller than the melting core (video and voice, together down roughly $1.5 billion), so the two nearly cancel and the sign flips. The decline is a mix crossover, not an operating collapse — the company has passed the point where its shrinking legacy products can be fully papered over by its growing ones.
The video melt is large and orderly. Residential video revenue fell $1.43 billion, of which $813 million was lost customers (255,000 fewer residential video subscribers), $322 million was a reallocation of streaming-app costs netted inside video revenue, and $291 million was rate and package mix as customers migrate to cheaper tiers [10]. Voice lost 804,000 wireline customers and $87 million of revenue [11]. What holds the picture together is the relationship, not the product: residential customer relationships slipped only to 29.61 million from 29.96 million, because the bundle keeps the household even as video and voice fall away underneath it [12].
Why the melt lifts the margin
The counter-intuitive part is that video's decline makes the company more profitable, not less. Video is a low-margin, largely pass-through business: most of its revenue leaves again as programming payments to content owners. As video shrinks, that cost shrinks with it. Programming was the single largest operating expense at roughly $8.8 billion in 2025, down from $9.7 billion, falling from 29% to 27% of total operating costs as the video base and package mix declined [13].
That is why the operating margin has climbed even as growth has faded. Over FY2019–FY2025, operating margin rose from 14.2% to 23.6% while revenue growth fell from 4.9% to below zero.
Source: derived from reported financials, FY2019–FY2025 10-Ks [14]; programming-cost mechanism per FY2025 10-K [15].
The rising line and the falling line are the same story told twice. Margin strength here is not being manufactured by growth; it is being manufactured by the retreat of a low-margin product. That is a genuine and durable form of mix benefit — but it is finite. Programming cost cannot fall forever, and when the video base is small enough, the margin tailwind from its decline runs out.
Mobile crosses over
Mobile is the one line that is both growing fast and beginning to help the bottom line. Service revenue rose 22.0% to $3.76 billion, from $1.70 billion in 2022, as residential mobile lines grew by 1.8 million in the year to 11.37 million [16]. For most of its life this business was a customer-retention subsidy: Charter sold mobile cheaply to lock the broadband relationship, and the direct costs ran ahead of the revenue. In 2025 that inverted. Management states Adjusted EBITDA grew "with mobile revenues growing at a faster rate than mobile direct costs" — the first clean statement that mobile is now additive to profit, not a drag on it [17].
That crossover is why a 41.5% Adjusted EBITDA margin held — indeed edged up 0.6% to $22.71 billion — in a year revenue fell. Two caveats belong on the record and are developed elsewhere. First, the filing does not disclose mobile as a standalone profit line; its direct costs sit inside "other costs of revenue," which rose $353 million on higher mobile volumes, so the crossover is management's characterization rather than a reported segment margin [18]. Second, Charter's mobile network is not its own — it resells a competitor's, an economic dependence the competitive chapter examines.
From 41.5% EBITDA to 8% free cash flow
Here is the gap the chapter opened on. A business generating $22.71 billion of Adjusted EBITDA — 41.5% of revenue — delivered $4.42 billion of free cash flow, an 8.1% margin. Two deductions consume the difference, and both sit below the operating line.
Adjusted EBITDA ($M)
Capital Expenditure ($M)
Interest Wedge ($M)
Free Cash Flow ($M)
Sources: Adjusted EBITDA and income from operations, FY2025 10-K [19]; capital-expenditure table [20]; interest wedge derived as income from operations less pretax income, FY2025 10-K [21]; FCF per reported financials.
The first deduction is capital expenditure — $11.66 billion, or 21.3% of revenue, the highest intensity in the company's decade and roughly double the 10.4% peer median. Its composition is telling: $7.72 billion of core capital (customer equipment, scalable infrastructure, upgrade/rebuild, support), plus $3.94 billion of line extensions, of which $2.20 billion is subsidized rural construction [22]. The discretionary growth spend — rural expansion plus the DOCSIS 4.0 network evolution introduced in The Broadband Incumbent — is the portion management frames as peaking, and the cash-recovery case is most sensitive to whether it rolls off.
The second deduction is interest. Operating income of $12.91 billion falls to $7.46 billion of pretax income — a roughly $5.45 billion annual wedge, the cost of carrying $94.3 billion of net debt [23]. That wedge consumes about 42% of operating income before a dollar of it reaches equity. Leverage is not a footnote to this model; it is the second-largest claim on the cash the business produces, ahead of taxes and behind only capex.
Flat profit, collapsing cash
The clearest way to see that free cash flow here is a capital-and-financing story, not an earnings story, is to watch profit and cash diverge. Net income attributable to shareholders held in a narrow $4.6–5.1 billion band every year from FY2021 to FY2025. Over the same window free cash flow fell from $8.60 billion (2021) to $3.16 billion (2024) — a 63% collapse — before recovering to $4.42 billion in 2025. Nothing in earnings moved; capital intensity did.
Source: derived from reported financials, FY2020–FY2025 10-Ks — FCF margin and capex/revenue series.
The two lines are near-mirror images: as capex intensity climbed from 14.8% of revenue to 21.3%, the free-cash-flow margin fell by roughly the same amount, then ticked up in 2025 as capex growth flattened. That leaves the 2025 recovery to explain — and it did not come from the operating business.
The 10-K walks the $747 million year-over-year increase in free cash flow to its drivers, and the largest by far is a $669 million reduction in cash paid for taxes, after the One Big Beautiful Bill Act restored 100% bonus depreciation in July 2025. Lower cash interest added $347 million and favorable mobile-device working capital added $398 million. Higher Adjusted EBITDA contributed just $139 million; capital expenditure actually rose, subtracting $390 million, and other working capital subtracted $455 million [24].
Source: FY2025 Annual Report (Form 10-K), free-cash-flow drivers and new tax legislation [25].
The FY2025 free-cash-flow improvement was driven mainly by a $669M drop in cash taxes from restored bonus depreciation, not by operations: Adjusted EBITDA added only $139M and capital expenditure rose. Bonus depreciation accelerates the timing of tax deductions rather than adding to them permanently, so a portion of this benefit is borrowed from future years.
Separating a durable inflection from a timing benefit matters because the peak-capex-then-recovery story is the one the equity is priced on — the said-versus-did record on that promise, and the price it produced, are the ground of the closing act.
Cash quality: clean above the line, capex-governed below
None of this is an earnings-integrity problem. Above the free-cash-flow line, the accounting is clean and the cash conversion is high. Operating cash flow was $16.08 billion against consolidated net income of $5.77 billion, a 2.79x conversion, bridged by roughly $8.71 billion of depreciation and amortization and a recurring deferred-tax build (the deferred-tax liability rose to $19.84 billion from $18.85 billion) — standard non-cash items for a capital-heavy operator, not accrual engineering [26]. KPMG issued an unqualified opinion, internal control over financial reporting was assessed effective with no material weakness, and there was no restatement [27]. The largest judgmental estimate on the balance sheet is the $67.47 billion of indefinite-lived franchise intangibles — 44% of the $154.2 billion asset base — carried without impairment [28].
Two things below the headline deserve a reader's attention. Charter steers on Adjusted EBITDA, a figure 76% above income from operations ($22.71 billion versus $12.91 billion), and reports its own free-cash-flow definition of $5.00 billion, about $0.6 billion above the raw operating-cash-flow-minus-capex figure of $4.42 billion, the gap being an add-back of capex-related accruals [29]. Both measures are reconciled, but both flatter the statutory numbers, and leverage is governed against the higher one.
The second is a growing consumer-credit exposure hiding inside a connectivity balance sheet. Accounts receivable grew 42.6% from FY2021 to FY2025 — to $3.68 billion — while revenue grew just 6.0%; in FY2025 alone receivables rose $583 million as revenue fell [30]. The driver is device financing: as Charter sells phones on equipment-installment plans, it books a receivable for the unpaid handset. Equipment-installment receivables inside accounts receivable reached $1.28 billion (from $967 million), with a further $1.11 billion classified as noncurrent [31].
Accounts Receivable ($M)
Device (EIP) Receivables in AR ($M)
Pledged EIP Principal ($M)
Allowance for Doubtful Accts ($M)
Sources: consolidated balance sheet, FY2025 10-K [32]; EIP receivables note [33]; EIP Financing Facility note [34].
Charter funds this book the way a lender would: it sells the receivables into a bankruptcy-remote special-purpose vehicle and borrows against them under an EIP Financing Facility, whose carrying value grew to $1.45 billion from $1.07 billion; the SPV holds $2.2 billion of pledged receivables (up from $1.6 billion) plus $121 million of restricted cash [35]. It is on the balance sheet and modest against a $94 billion debt stack, but it is a securitization structure scaling with mobile growth — a financing of working capital, not an operating cash source — and the allowance for doubtful accounts ($219 million, up from $204 million) is growing more slowly than the receivable it covers. The same mobile crossover that lifts EBITDA quietly embeds a consumer-credit line inside the model.
Where this leaves the reader
The Spectrum machine is a rate-versus-volume engine bolted to a mix shift and a heavy fixed-cost tail. Price still beats volume on the one line that matters, by a narrowing margin; the decline of video manufactures operating margin even as it shrinks the top line; mobile has crossed into profit and holds EBITDA flat. But the cash that reaches an owner is set below the operating line — by a record capex bill management says is about to fall, and by a $5.4 billion interest load that will not. FY2025's cash uptick was mostly a tax-timing gift, not proof the build is over.
That hands the next question to the field. The whole model depends on Internet rate continuing to out-run subscriber losses — and both the rate and the base are set by competition. The next act examines the moat that is supposed to protect them, and why it is leaking.
Scale Without Pricing Power
The money machine described in The Broadband Fulcrum depends on Internet rate continuing to out-run subscriber losses. Both halves of that sentence — the rate and the base — are set outside the company, by whoever else can sell a home a broadband connection. This act examines the wall that is supposed to hold those competitors off, and finds it is built of the right material in the wrong place. Charter's advantage is real, but it is an advantage of incumbent scale and low-cost plant, not of pricing power or customer lock-in. And on the metric that matters most — the share of homes it passes that actually buy from it — the wall is leaking.
Homes Passed
Internet Customers
Penetration of Passings
Mobile Lines
Figures as of December 31, 2025 (passings and mobile lines in millions, penetration in %). Passings grew 2.7% year-over-year; Internet customers fell 1.3%; penetration was 54.5% versus 56.7% a year earlier; mobile lines grew 19.4% [1].
The moat that is real: scale and cheap plant
What genuinely protects Charter is not nothing. Its network passes 58.4 million homes and businesses, the second-largest wireline footprint in the country, and that footprint already exists — the coaxial cable is in the ground, the poles are climbed, the easements are held. When Charter upgrades to the symmetrical, multi-gigabit speeds a fiber rival offers, it does so by re-provisioning that installed plant (the DOCSIS network evolution introduced in The Broadband Incumbent) rather than trenching new glass down every street. Management states the point plainly: "Unlike competitors, Spectrum upgrades its network to serve all of its passings and can do so at a much lower cost," with the build due to finish in 2027 [2].
That cost edge shows up in the one place a moat is supposed to: the margin line. Charter carries the widest operating margin in its peer group — 23.6% in FY2025, against roughly 20.7% for the wireless-led operators and 16.7% for Comcast (whose blended figure also carries an entertainment business, so the true cable-only gap is wider still). This is a cost-and-scale advantage, and it is specific to Charter rather than a gift of a good industry: a well-funded competitor cannot copy sunk plant, it can only build alongside it — which is exactly what the overbuilders are doing, at the higher cost the incumbent avoids. So far, so durable.
The leak: falling penetration on a growing footprint
Dividing customers by the homes they could serve exposes the trouble at once. Charter is extending its network — passings grew 2.7% in 2025 and reached 58.7 million by March 2026, helped by subsidized rural construction [3]. Yet the share of those passings that buys anything from Charter is falling faster than the footprint is growing: total customer-relationship penetration slid from 56.7% at the end of 2024 to 54.5% a year later and 54.0% by March 2026 [4] [5].
Source: Charter Q4 FY2025 and Q1 FY2026 operating statistics — estimated passings and total customer-relationship penetration of passings [6] [7].
The gap between the two lines is the tell. A saturated but stable market would show flat penetration on flat passings — everyone who wants cable already has it. Falling penetration on a growing footprint means Charter is losing homes it already reaches to someone else, and adding new passings faster than it can fill them. The core product confirms it: total Internet customers fell to 29.68 million from 30.08 million over 2025, and the quarterly bleed is widening, not healing — a loss of 119,000 in the fourth quarter of 2025 [8], then 120,000 in the first quarter of 2026 against just 59,000 in the same quarter a year earlier [9].
Where the share goes
Charter names its attackers in its own filing: fiber-to-the-home from AT&T and Verizon, at the footprint overlap The Broadband Incumbent set out, and fixed-wireless home internet delivered over the mobile carriers' 5G networks [10]. That chapter established that these overbuilders exist; the point here is that their gains and Charter's losses are the same customers changing hands. While Charter's Internet base shrank by roughly 400,000 in 2025, AT&T added 1.1 million fiber customers to reach 10.4 million, and lifted its total broadband base from 15.3 million to 16.0 million connections [11]. One incumbent's plant advantage does not stop a fiber rival from growing its home-internet base while the incumbent's own contracts.
Sources: Charter total Internet customers, Dec 2025 vs Dec 2024 [12]; AT&T fiber and total broadband connections, year-end 2025 vs 2024 [13].
Fixed wireless is the second front, and a newer one — a mobile carrier selling home internet over spare 5G capacity, with no wire to the home at all. It is a low-price substitute that barely existed at scale a few years ago, and it structurally caps how hard cable can push broadband pricing. The threat is not Charter's alone: the fiber game even cuts both ways among the cable operators, with Altice USA reporting that "large national providers such as Comcast and Charter are currently deploying significant fiber and network overbuilds" into its footprint [14]. Everyone is building into everyone.
Pricing power, inverted
This is where the moat's true shape emerges. Residential Internet revenue still grew in 2025, and The Broadband Fulcrum traced how rate step-ups out-weighed volume losses on that line. But growing revenue on a rate line is not the same as pricing power, and the distinction matters. Pricing power is the ability to raise the real price a customer pays and keep them. Charter is doing the opposite: it is spending price to hold volume.
The giveaways are concrete. In the first quarter of 2026 it launched a "$1,000 savings guarantee," promising customers who take Spectrum Internet and switch two or more mobile lines from Verizon, AT&T or T-Mobile a full $1,000 of first-year savings or Charter covers the difference [15]. Its "Life Unlimited" repackaging lowered everyday broadband pricing. Its TV Select customers now receive up to roughly $117 a month — soon $129 — of streaming-app retail value bundled in at no extra cost [16]. The result reaches the reported number that ostensibly shows strength: monthly residential revenue per customer actually fell year-over-year — to $117.19 in December 2025 from $118.65 a year earlier, and to $118.44 in March 2026 from $120.07 [17] [18].
The switch guarantee also gives away the moat's other missing wall — customer lock-in. Cable is often assumed to have high switching costs, but Charter's own tactics reveal the opposite: its mobile lines carry no contract, and a company that has to pay a departing rival's customer $1,000 to come over, and offer the same to keep its own, is operating in a market where leaving is cheap. Low switching costs are why the base is so contestable, and why price, not friction, is doing the retention work.
The growing weapon leans on a rival
Charter's one genuinely growing product is mobile, and it is the mechanism meant to make the bundle stick: total lines rose 19.4% to 11.77 million in 2025 [19]. A household with Spectrum Internet and Spectrum Mobile is measurably harder to poach than one with broadband alone. But the weapon has two dependencies worth naming.
The first is whose network it runs on. Spectrum Mobile is a mobile virtual network operator: it stitches together Charter's own 49 million out-of-home WiFi access points with a lease of Verizon's cellular network for nationwide coverage, and in July 2025 signed a further multi-year deal to use T-Mobile's network for its business customers [20]. Every mobile line Charter sells to defend a broadband customer sends a wholesale payment to Verizon — one of the two fiber overbuilders taking those same broadband customers. The offense funds a competitor's core.
The second is momentum. Mobile-line growth is decelerating even as the headline base swells: net additions fell to 428,000 in the fourth quarter of 2025 from 522,000 a year earlier, and to 368,000 in the first quarter of 2026 from 507,000 [21] [22].
Source: Charter Q4 FY2025 and Q1 FY2026 mobile-line net additions [23] [24].
So the convergence weapon compresses the very price it defends (the discounted bundle pulls broadband revenue-per-customer down), rides a rival's radio network, and is slowing. It is a real offset to broadband dilution, but not a decisive one.
A sector condition, not a stumble
The most useful test of whether this is a Charter problem or a cable problem is to watch the other incumbent do the identical thing. Comcast — larger than Charter — is running the same playbook by a different name: a five-year price guarantee, simplified market-based broadband pricing, and free wireless lines, explicitly described as "rate reinvestment" that it expects to pressure results near-term. It named the cost directly: a 4.5% decline in connectivity-and-platforms EBITDA, with broadband revenue-per-customer growth decelerating to 1.1% [25]. Two cable incumbents, independently, trading broadband pricing for retention and leaning on wireless to hold the relationship. When both scale leaders reach for the same lever at the same time, the lever is a property of the industry.
The equity market has drawn the same conclusion, and drawn it hardest against the purest expression of the model: the peer de-rating that The Broadband Incumbent scored out is concentrated exactly where the model is most exposed to fiber and fixed-wireless — a business whose whole engine is fixed-line broadband.
Where this leaves the wall
The measured read is that Charter has a narrow moat, and it is made of the wrong material for the threat it faces. Incumbent scale and a genuinely lower-cost upgrade path are real and hard to copy — they hold the cost line, which is why the operating margin is the widest in the group. What the evidence does not support is pricing power or switching costs: penetration is falling on a growing footprint, effective price is being cut through guarantees and giveaways, revenue-per-customer is down year-over-year, and the retention work is being done by a decelerating, MVNO-dependent mobile product rather than by any real friction keeping customers in place.
The strongest fact against this reading is that the margin still leads and mobile is still scaling fast, which would fit a cyclical squeeze — a fiber build-out phase that ends, and a fixed-wireless substitute that eventually hits the capacity ceiling of a shared cellular network. What would distinguish the two is observable and cheap to watch: penetration stabilizing and Internet net additions returning toward zero as the overbuild wave matures would argue the moat is holding; another year of the scissors widening would argue it is structural. On the evidence through early 2026, the scissors are still opening.
Holding that line is not free. Charter is spending 21.3% of revenue on capital expenditure — roughly double its peers — to keep this footprint competitive, the highest intensity in a decade. The next act turns to how a company already carrying more than $94 billion of net debt has financed that defense while also retiring nearly a third of its shares — and why that capital machine is now being thrown into reverse.
Buybacks to a Handover
The Machine That Ran on Borrowed Shares
Defending a shrinking broadband base costs Charter 21.3% of revenue in capital spending against $94 billion of net debt. The question this act answers is what the company did with the cash the network threw off before that build — and the answer is singular. For a decade Charter returned capital exactly one way: it bought its own stock, and it borrowed to do it. It has never paid a cash dividend and says it does not intend to [1]. Since the buyback program began in September 2016, Charter has repurchased roughly 179.7 million shares and Charter Holdings units in the public market for approximately $78.8 billion [2]. That is the whole capital-return story of the last ten years, and it is now running in reverse.
The scale is easier to see against the cash the business actually generated. In the peak years the repurchase bill ran well above free cash flow; the gap was filled with debt.
Source: derived from reported financials, FY2016–FY2025 Forms 10-K, Consolidated Statements of Cash Flows [3].
Across FY2016–FY2025 Charter spent more repurchasing stock than the business produced in free cash flow, and it funded the difference by letting the balance sheet grow: net debt rose from $60.2 billion at the end of 2016 to $94.3 billion at the end of 2025, up $34.1 billion [4]. The purpose was arithmetic: with revenue flat to falling, per-share value had to come from a smaller denominator. It did. Diluted shares fell from 235.5 million in 2018 to 137.7 million in 2025, a cut of roughly 42% [5]. Charter shrank its share count while its debt climbed, and the two moved in lockstep because they were the same transaction.
Source: derived from reported financials, FY2016–FY2025 Forms 10-K; net debt is total debt less cash [6].
The 2017 bump — a share count that briefly jumps to 296.7 million — is the residue of the 2016 Time Warner Cable and Bright House deals that built modern Charter with equity. Everything after is the buyback pulling the count back down. This is the identity The Broadband Incumbent and The Broadband Fulcrum described from the outside: a company whose equity story was manufactured on the financing line, not the revenue line.
A Leverage Band, Not a Discipline
Management's framing of this is discipline. Charter runs to a stated target of 4.0 to 4.5 times net debt to adjusted EBITDA, "near the midpoint," and it has held there with unusual steadiness — 4.15 times at the end of 2025 on roughly $94.6 billion of debt principal [7]. The leverage ratio is the constant. What flexed was the buyback.
Source: derived from reported financials, FY2021–FY2025 Forms 10-K [8]. Capex/revenue rose 14.8% → 21.3% over the same span.
Repurchases fell from $15.4 billion in 2021 to $1.2 billion in 2024 — down 92% — while capital intensity climbed to a decade high [9]. Leverage barely moved through all of it. That is the tell: if the band is fixed and capex is rising, the buyback is not a return policy set by management's read of value — it is the residual, whatever cash the network build and the leverage target leave behind. In the fourth quarter of 2024 the residual went to nearly nothing. Charter repurchased just 292,000 shares for $113 million, an explicit pause held open pending the February 2025 Liberty Broadband shareholder vote, even as its leverage drifted down to 4.13 times [10]. Management's own stated order of priorities names the buyback last: free cash flow goes "for organic opportunities first and then accretive M&A and buybacks" [11]. For a decade the first two claims were small, so the buyback got almost everything. That ordering is about to be tested by the first large deal in ten years.
The Price of the Shares It Bought
Because the buyback was the equity story, the prices Charter paid are part of the record. The company discloses an average repurchase price each quarter, and the trajectory is stark: about $384 per share in the fourth quarter of 2024, roughly $262 in the fourth quarter of 2025 (2.9 million shares for $760 million), and $225 in the first quarter of 2026 [12] [13]. On 22 July 2026 the stock implied roughly $129 per share. The $78.8 billion the program deployed since 2016 was spent across a price range that runs from about $225 to well above $400, against an equity the market now values at about $17.8 billion in total [14]. The per-share accretion that justified borrowing to buy stock was real when it retired shares cheaply relative to their later value; measured against today's price, most of the capital was returned above where the shares now trade. The arithmetic is left for the reader — but it is the reason a decade of shrinking the count did not compound into a rising equity value.
Charter has repurchased roughly 179.7 million shares for about $78.8 billion since 2016 at prices ranging from about $225 to over $400, and has never paid a dividend. The entire equity is now worth about $17.8 billion, or roughly $129 per share.
The Machine in Reverse
For ten straight years Charter spent nothing on acquisitions — cash used for acquisitions was zero every year from FY2016 through FY2025. That decade of pure buyback is now reversing into the largest deal in the company's history, and the reversal is being paid for in the one currency the buyback existed to conserve: equity.
The Cox Transactions, announced 16 May 2025, combine Charter with Cox Communications' residential cable and commercial businesses. The cash piece is small and debt-funded — Charter will fund $4.0 billion of cash consideration with debt and assume roughly $12.6 billion of Cox net debt and finance leases [15]. The bulk of the consideration is stock: Cox Enterprises receives convertible preferred and common partnership units in Charter Holdings. The parallel Liberty Broadband Combination — announced 12 November 2024, whose principal asset is roughly 41.5 million Charter shares — is an all-stock unwind expected to close at the same time [16].
The net effect on the share count runs directly against the last decade. Management sized it plainly: at close Charter will issue the equivalent of just over 46 million shares to Cox Enterprises, partly offset by a reduction of about 6.8 million shares from the Liberty combination, so a standalone as-converted, as-exchanged share count that stood near 137.7 million would rise to about 179 million [17].
Source: FY2021–FY2025 shares as reported [18]; ~179M as-converted count at close per management [19].
Twenty-eight percent of the shares the company spent a decade retiring come back at close, issued to a family. The freed cash the roll-off is meant to produce — management frames the fall in capital spending from about $11.7 billion in 2025 toward below $8 billion by 2028 as over $28 of annual free cash flow per share — now has three claims on it rather than one: the buyback at a depressed price, a promised de-levering to a new 3.5 to 3.75 times target within three years of close, and integrating Cox [20]. How that fork is resolved is the next allocation decision, and it will be made under different owners than the ones who ran the buyback.
The Handover
Charter has always been a controlled company; the question the deal settles is by whom. Today two related holders, not the public float, decide the board. As of 31 December 2025 Liberty Broadband held about 29.22% of the vote and Advance/Newhouse about 13.12% — roughly 42% between them — under a stockholders agreement that fixes the board at thirteen directors, lets Liberty designate up to three nominees and A/N up to two, and gives each a seat on every board committee [21]. On paper the board is highly independent — twelve of thirteen directors are NASDAQ-independent, with CEO Christopher Winfrey the only insider and Eric Zinterhofer, founder of Searchlight Capital, as non-executive chairman. But five of those seats are affiliate-designated — three for Liberty, two for A/N — and those five are independent under NASDAQ rules yet not SEC-independent for audit-committee purposes [22].
The Cox and Liberty closings redraw this. Liberty Broadband's governance layer terminates and its three designees resign; A/N's rights are modified and preserved; and Cox Enterprises arrives as the new controlling shareholder with about 25.1% of the combined company's diluted shares [23]. Alexander C. Taylor, chairman and CEO of Cox Enterprises, becomes chairman of Charter's board for an initial three-year term; Zinterhofer steps down to lead independent director; and the amended stockholders agreement caps Cox acquisitions at 30% and A/N at 19%, with voting above the cap (30% for Cox, 15% for A/N) forced to mirror the public float [24].
Source: FY2025 10-K, control-structure and Cox governance disclosures [25] [26].
Winfrey said it himself on the call that opened the pause: the cable industry is "largely made up of family-owned or family-controlled entities making the decisions on potential combinations" [27]. Charter is completing that sentence about itself. The overhang the market watched for years — Liberty's stake and the eventual question of what it would do with it — is being resolved not by dissolution into the float but by transfer to a new family in the chair.
Whose Skin
The people running the company hold very little of it. CEO Winfrey owned 38,385 Charter shares in April 2026, worth about $5 million at the implied price; CFO Jessica Fischer held 2,546 [28]. The large economic stakes sit with the holder entities — Liberty Broadband alone held about 38.6 million shares [29]. Management's exposure is not owned equity that falls when minority holders' does; it is upside optionality.
Winfrey's amended employment agreement, approved in December 2025 and running to December 2028, makes the design explicit. On a base salary of at least $2.5 million and a target bonus of 300% of base, he receives annual stock-option grants with a grant-date fair value of at least $23 million from 2027, three-year cliff-vested, plus a $6 million top-up option in January 2026 [30]. These are ordinary options struck at grant-date price: they pay on any absolute recovery of the share price and are not indexed to how cable peers perform. The incentive is keyed to the same per-share number the buyback engine was built to lift — and it pays on a rebound whether Charter earns it or the sector simply re-rates.
The capital-return machine and insider liquidity are also plumbed together. Under a 2016 letter agreement, A/N sells shares back to Charter every month on a pro-rata basis alongside the public buyback, at the average price Charter paid that month — 1.0 million units for $373 million in 2025 alone [31]. A separate tax receivable agreement obliges Charter to pay A/N half of the tax benefit it realizes when A/N exchanges its Charter Holdings units [32]. And Charter booked about $39 million of FY2025 carriage revenue from HSN and QVC, whose parent is chaired by former Charter director Gregory Maffei [33]. None of this is hidden; all of it is disclosed. But it means part of what looked like a return of capital to all shareholders doubled as a managed sell-down channel for the largest ones — the buyback that shrank the float was also the exit ramp for the holders now handing over control.
The capital identity, then, is a company that borrowed to retire more than 40% of its shares at prices mostly above where they trade today, ran the repurchase as the flex variable beneath a fixed leverage band, and is now issuing 46 million new shares to install a new controlling family — while paying its CEO almost entirely in options on the price that whole machine was built to move. What remains unsettled is whether the capital freed by the promised capex roll-off flows back to buybacks, to the new de-levering target, or to integrating Cox, and under whose incentives that choice gets made. That is where the record of promises meets the price the market has put on them.
The Clock and the Price
The prior act left the reader with a company paying its chief executive almost entirely in options struck on a share price the buyback machine exists to move — and a control seat about to pass to the Cox family. This act is about the record those options are wagering on. Charter's equity fell 71.6% from its high, more than twice the peer median, and now trades near three times earnings while consensus has per-share cash flow rising for years. Both of those facts are real. Reconciling them is the work of this chapter, and it begins with what management promised.
The reconciliation runs through timing. A network build was supposed to peak, so free cash flow could inflect, on a date that kept moving. Two commitments carried the equity — capex peaking and broadband returning to growth — and both were missed across 2023 through 2026, even as a second set of promises, the ones management controlled directly, were kept.
The ledger: what was said, and what came
A management team's credibility is not one number; it is a record, and Charter's record splits cleanly in two. The commitments inside the company's own operational control were delivered. The forecasts about capital timing and the competitive environment — the ones the stock actually traded on — were not.
Sources: Q2 2023 earnings call [1]; Q4 2025 call [2]; Q4 2023 call [3]; Q3 2024 call [4]; Q3 2025 call [5]; Q1 2026 call [6]; Q1 2024 call [7].
The headline promise broke on the date it came due. In the second quarter of 2023, chief financial officer Jessica Fischer told investors that once the network-evolution build finished — expected "at the end of 2025 or the beginning of 2026" — capital expenditures excluding line extensions would "decline to below 2022 levels and continue to decline thereafter" [8]. That is the sentence the free-cash-flow-inflection thesis was built on. What arrived instead was a rising bill: FY2025 total capex reached 21.3% of revenue, the highest in the five-year record and roughly four points above 2022's 17.4%. By the January 2026 call the completion date had moved to 2027, and the intensity target had been recast as "13% to 14% of revenue by 2028" [9]. The inflection did not disappear; it receded about two and a half years down the road.
The competitive forecast fared no better. Management called fixed-wireless "temporary" in late 2023 [10], then declared cell-phone Internet at or past its "peak" more than once — "will run out of capacity… you're already starting to see some signs of that paring back" in early 2024 [11], and "have we seen the peak cell phone Internet impact? It appears that's the case" in late 2024 [12]. By the third quarter of 2025 the framing reversed: AT&T was "new to the space" in fixed wireless, an expanding competitor rather than a fading one [13]. The base kept shrinking through it — another 120,000 Internet customers lost in the first quarter of 2026 [14] — the erosion Scale Without Pricing Power traced in detail. A "return to growth over time" was asserted on call after call; no call ever dated it.
Against those misses sits a genuinely kept record. Subsidized rural passings came in at 483,000 over the twelve months to Q4 2025, above the 450,000 target [15]. The late-2024 repricing and streaming rebundling cut quarterly video net losses from about 408,000 to 60,000 by Q1 2026 [16]. The buyback pledge sits in between: the Q1 2024 promise to "maintain our buybacks over the course of the year" [17] gave way to a 62% cut to $1.21B in FY2024 during the Liberty pause, before repurchases resumed to $5.13B in FY2025. The pattern is consistent: what management could build, it built; what it had to forecast about capital timing and competition, it got wrong, in the same direction, for two and a half years.
The de-rating: how the misses were priced
The stock did not drift down. It stepped down, on the dates those misses printed. It held above $400 through the first half of 2025 — the Cox merger was announced on 16 May 2025 with the stock at $427.25, a local peak — then broke after each earnings report that confirmed the broadband and capex trajectory.
Source: market data, monthly close, as reported.
The dates map to the disclosures. The stock lost roughly a third of its value in the last week of July 2025, when Q2 results printed accelerating broadband losses; it stepped down again after the Q4 2025 report in late January 2026, briefly bounced when the FCC approved the Cox deal on 27 February 2026, then fell through the Q1 2026 print of another 120,000 lost Internet customers on its way to a $125.54 trough on 22 June 2026.
Source: market data and dated results releases, as reported; Q1 2026 broadband print [18].
Measured from its 18 September 2023 high of $455.73, the stock was down 71.6% on 22 July 2026 — the deepest drawdown in the peer set save Cable One, and against a peer median of −30.0%. That is the anomaly that opens the report, seen from the other end: the de-rating is company-specific and roughly twice the sector, concentrated in the pure cable-broadband model, and it re-rated in discrete steps as the specific promises this chapter opened with were falsified on specific dates.
The thin levered residual
What that price move produced is an equity that is small relative to the enterprise it claims. On 22 July 2026 the market capitalization was $17.80B against FY2025 net debt of $94.28B, so enterprise value is roughly $112B and the equity is only about 16% of it. Put differently, net debt is more than five times the market cap. That ratio governs how this stock now behaves: a small percentage change in enterprise value translates into a large percentage change in the equity, in either direction. The stub is where the leverage lands.
Drawdown from 3-yr high
P/E (TTM)
Equity as % of EV
Trailing FCF yield
Sources: drawdown, market cap and FCF yield from reported financials and market data, as reported; P/E (TTM) of 3.46x on EPS TTM of $36.97, per market data.
On the trailing numbers, the equity looks priced for very little: about 3.5 times earnings, a forward multiple near 3.1 times, and a 24.8% trailing free-cash-flow yield on FY2025's $4.42B of free cash flow, with the company still buying back stock. A yield that high on a business generating cash and repurchasing shares is not the market disputing the level of the cash flow. It is the market discounting its durability — pricing a meaningful probability that the broadband base keeps eroding faster than rate and mobile can offset, and that the $5.4B annual interest claim (The Broadband Fulcrum) keeps first call on whatever the network throws off.
The contradiction: the price versus the estimates
Here is where the price and the sell-side stop agreeing. Consensus does not underwrite growth — it underwrites the capex roll-off this chapter began with. Analysts model revenue and EBITDA roughly flat through the end of the decade, but capital expenditure falling from about $11.5B toward $8B, net debt de-levering from roughly $95B toward $81B, and free cash flow rising from about $5.0B in 2025 toward $7.3B by 2028. With a share count still shrinking, per-share earnings climb from about $36 into the low-$50s over the same window.
Source: consensus estimates FY2025–FY2028, as reported; FY2029 is thinly covered and omitted.
The entire per-share improvement comes from that capex fade against flat EBITDA — the same fade management has guided to since 2023, now dated to 2028. Measured against today's $17.80B market cap, those consensus cash-flow estimates imply forward free-cash-flow yields of roughly 27% for 2026, 34% for 2027 and 41% for 2028. Yields at that level mean the price assigns almost no present value to the back years of the projection.
Source: trailing FCF from reported financials; forward figures are consensus estimates divided by the 22 July 2026 market cap, as reported.
Management makes the same arithmetic explicit. On the Q1 2026 call, the company noted that if you take consensus 2026 free cash flow but substitute its expected 2028 capex, "our current stock price would imply a free cash flow multiple of only about 3.8x, and a free cash flow yield of over 25%" [19], and at the January call it named the gap directly: the task, the CFO said, is "to overcome the perception of negative perpetuity growth implied in our valuation today" [20]. That is the contradiction stated in the company's own words: the price embeds terminal decline, the estimates embed a cash-flow inflection, and the two cannot both be taken at face value.
The sell-side does not resolve it so much as spread out across it. The mean price target is $208, the median $190 — implying more than 60% upside — but the range runs from $110 to $413, and the rating split is hold-tilted, five buys against eleven holds and five sells or underperforms.
Source: consensus analyst targets (n=17), as reported.
A $110-to-$413 spread on one name is not a central estimate the market simply disputes; it is a distribution with two humps. One tail is the capex roll-off arriving and flat EBITDA converting into the 40%-plus forward yields consensus embeds; the other is the broadband base eroding through the interest wedge until the levered equity thins further. The step-wise chart above is the market re-weighting those two outcomes, one earnings date at a time.
What is genuinely unresolved
The evidence does not close this. What it does is name, precisely, the questions a reader should hold open — each checkable against a future filing.
The first is the timing itself. The capex-peak-and-inflection promise has been made since 2023 and dated, now, to 2028; whether spend actually fades toward the guided 13–14% of revenue, quarter after quarter, is the variable the whole per-share-cash-flow case turns on. It is checkable directly: capex intensity in each results release, and whether Internet net additions move back toward zero rather than the roughly −120,000 they printed in Q1 2026 [21].
The second is that today's price is provisional, because the base it prices is about to change. The Cox combination — FCC-approved and pending only California — carries an estimated pro-forma purchase price of about $18.6B, of which the equity portion was fair-valued at Charter's $208.75 close on 31 December 2025 [22], well above the $129 the stock trades at now. On close the share count rises toward roughly 179 million and the leverage target moves to 3.5–3.75x [23]; the mechanics of that reversal are the subject of Buybacks to a Handover. Any multiple computed on standalone Charter is therefore a placeholder.
The third is whose hands run the next attempt. The team that missed the capex-timing and competitive forecasts also kept every build promise it made — a split record that resists a single reading — and it is now being paid, and re-governed, for the recovery it is forecasting. The chief executive holds about $5M of stock but is compensated overwhelmingly in absolute-price options; Liberty's governance layer falls away at close and the Cox family takes the chair with roughly a quarter of the vote. The alignment those facts create between the controllers, the option-holding management, and the minority equity — under a leverage target that competes with the buyback for the same freed cash — is the open governance question the next attempt to prove this model will be run inside.
The inflection has been reset to 2028. The price says the market has stopped extending credit for it; the estimates say the sell-side still will. The record this chapter walked is why a reader now has everything needed to weigh which one to believe — and exactly which line items, in which filings, will settle it.
The numbers behind Charter Communications, Inc.: as-reported financial statements and company metrics for FY2021–FY2025, traced to the source filings, opened with the share-price history those statements have to justify. Every linked figure opens the exact page of the filing it was printed on, with the statement row highlighted. Amounts in US$ millions unless noted.
Reading notes: Each fiscal year FY2021–FY2025 is cited to its own Form 10-K, where that year is the first (current) reporting column of the consolidated statements. Revenue by product line uses Charter's current disaggregation from the FY2025 Form 10-K (Note 14), which added a Connectivity subtotal and split commercial revenue into Small business and Mid-market large business. Charter restated FY2023–FY2024 onto this basis; FY2021–FY2022 are not presented on the current basis and are left blank in the revenue breakdown (their full income statement, balance sheet and cash flow are shown and cited to the FY2021/FY2022 10-Ks). In the Long-Term Record, FY2016–FY2018 are from the standardized SEC XBRL data feed and shown without page links; FY2019–FY2020 are cited to the comparative columns of the FY2021 Form 10-K, and FY2021–FY2025 to each year's own 10-K. The standardized data feed ties to the filed statements across revenue, operating income, net income, total assets, long-term debt, operating cash flow and capex for FY2021–FY2025 with no material discrepancies.
Share Price — Full Available History — 17 Years
The stock closed at $129.22 on Jul 22, 2026 — up 269% over the window shown (+8.2% a year), trading between $29.50 and $821.01. At that close the stock trades at 3.6× FY2025 diluted EPS as reported below.
Source: market price feed, monthly closes, sampled from 4,162 source observations, Jan 2010–Jul 2026. Price return only, excludes dividends.
Market capitalization $30.3bn and enterprise value $124.6bn.
Market cap = 234.8M shares outstanding × the Jul 22, 2026 close of $129.22. Enterprise value adds total debt of $94.8bn and subtracts cash and equivalents of $477mn (net debt of $94.3bn), from the FY2025 balance sheet. Market-derived figures, shown without filing links.
FY2025 at a Glance
Revenue (US$ millions)
Net income (US$ millions)
Diluted EPS
Source: FY2025 consolidated statements [1] [2] [3] [4]. Click any linked figure to open the filing page with the row highlighted.
Revenue by Product Line
| Revenue by Product Line | FY2021 | FY2022 | FY2023 | FY2024 | FY2025 |
|---|---|---|---|---|---|
| Internet | — | — | 23,032 | 23,360 | 23,765 |
| Mobile service | — | — | 2,243 | 3,083 | 3,762 |
| Connectivity | — | — | 25,275 | 26,443 | 27,527 |
| Video | — | — | 16,353 | 15,129 | 13,703 |
| Voice | — | — | 1,510 | 1,437 | 1,350 |
| Residential revenue | — | — | 43,138 | 43,009 | 42,580 |
| Small business | — | — | 4,355 | 4,376 | 4,346 |
| Mid-market and large business | — | — | 2,767 | 2,878 | 2,969 |
| Commercial revenue | — | — | 7,122 | 7,254 | 7,315 |
| Advertising sales | — | — | 1,551 | 1,780 | 1,468 |
| Other | — | — | 2,796 | 3,042 | 3,411 |
| Total revenues | — | — | 54,607 | 55,085 | 54,774 |
| Total revenues growth, derived | — | — | — | +0.9% | -0.6% |
Source: Form 10-K Note 14 (Revenues) — revenues by product line (current basis, restated FY2023–FY2024) [5]. Click any linked figure to open the filing page with the row highlighted.
Income Statement
Source: Consolidated Statements of Operations [1] [2] [3] [4]. Click any linked figure to open the filing page with the row highlighted.
Columns marked E are consensus analyst estimates from S&P Capital IQ (CapIQ), shown alongside reported results for direct comparison; they are not company guidance.
Estimate source: S&P Capital IQ (CapIQ) consensus, as of 2026-07-25. Estimate figures are S&P Capital IQ consensus (vendor data — no filing page links). EPS and net income use the normalized (adjusted) consensus where the street reports it. Line-item analyst models (segments, drivers, KPIs) are in the Visible Alpha tab.
Balance Sheet
Source: Consolidated Balance Sheets [6] [7] [8] [9]. Click any linked figure to open the filing page with the row highlighted.
Cash Flow
Source: Consolidated Statements of Cash Flows [10] [11] [12] [13]. Click any linked figure to open the filing page with the row highlighted.
Customer Relationships Monetization
| Customer Relationships Monetization | FY2021 | FY2022 | FY2023 | FY2024 | FY2025 |
|---|---|---|---|---|---|
| Total customer relationships (000s) | 32,069 | 32,195 | 32,126 | 31,473 | 31,846 |
| Residential customer relationships (000s) | 29,926 | 29,988 | 29,904 | 29,258 | 29,609 |
| Monthly residential revenue per residential customer ($) | 113.61 | 114.66 | 119.89 | 121.04 | 119.05 |
| Monthly small business revenue per SMB customer ($) | 165.50 | 164.50 | 163.64 | 164.08 | 161.50 |
Source: company filings [14] [15] [16] [17]. Click any linked figure to open the filing page with the row highlighted.
Subscribers by Product
| Subscribers by Product | FY2021 | FY2022 | FY2023 | FY2024 | FY2025 |
|---|---|---|---|---|---|
| Total Internet customers (000s) | 30,089 | 30,433 | 30,588 | 30,080 | 29,680 |
| Total mobile lines (000s) | 3,564 | 5,292 | 7,766 | 9,883 | 11,766 |
| Total video customers (000s) | 15,833 | 15,147 | 14,122 | 12,892 | 12,605 |
| Total voice customers (000s) | 9,903 | 8,983 | 8,005 | 6,884 | 6,046 |
Source: company filings [14] [15] [16] [17]. Click any linked figure to open the filing page with the row highlighted.
Capital Expenditures by Category
| Capital Expenditures by Category | FY2021 | FY2022 | FY2023 | FY2024 | FY2025 |
|---|---|---|---|---|---|
| Customer premise equipment | 1,967 | 2,209 | 2,286 | 2,172 | 2,260 |
| Scalable infrastructure | 1,677 | 1,791 | 1,368 | 1,422 | 1,536 |
| Upgrade/rebuild | 706 | 845 | 1,719 | 1,771 | 1,937 |
| Support capital | 1,643 | 1,541 | 1,727 | 1,688 | 1,986 |
| Line extensions | 1,642 | 2,990 | 4,015 | 4,216 | 3,940 |
| Mobile network capital expenditure | 482 | 376 | 314 | 245 | 267 |
Source: company filings [18] [19] [20] [21]. Click any linked figure to open the filing page with the row highlighted.
Network Investment Rural Expansion
| Network Investment Rural Expansion | FY2021 | FY2022 | FY2023 | FY2024 | FY2025 |
|---|---|---|---|---|---|
| Subsidized rural construction — capital expenditure | — | — | 1,870 | 2,152 | 2,208 |
| Subsidized rural passings activated in year | — | — | 295,000 | 393,000 | 483,000 |
| Cumulative capital invested in rural build (since 2022) | — | — | 3,400 | 5,500 | 7,700 |
Source: company filings [18] [22] [23] [19]. Click any linked figure to open the filing page with the row highlighted.
Long-Term Record
| Fiscal year | Total revenue | Income from operations | Net income attributable to Charter shareholders | Diluted earnings per share | Net cash from operating activities | Capital expenditures |
|---|---|---|---|---|---|---|
| FY2016 | 29,003 | 2,456 | 3,522 | 0.00 | 8,041 | 5,325 |
| FY2017 | 41,581 | 4,106 | 9,895 | 0.00 | 11,954 | 8,681 |
| FY2018 | 43,634 | 5,221 | 1,230 | 0.00 | 11,767 | 9,125 |
| FY2019 | 45,764 | 6,511 | 1,668 | 0.00 | 11,748 | 7,195 |
| FY2020 | 48,097 | 8,405 | 3,222 | 0.00 | 14,562 | 7,415 |
| FY2021 | 51,682 | 10,526 | 4,654 | 0.00 | 16,239 | 7,635 |
| FY2022 | 54,022 | 11,962 | 5,055 | 0.00 | 14,925 | 9,376 |
| FY2023 | 54,607 | 12,559 | 4,557 | 0.00 | 14,433 | 11,115 |
| FY2024 | 55,085 | 13,118 | 5,083 | 0.00 | 14,430 | 11,269 |
| FY2025 | 54,774 | 12,908 | 4,987 | 0.00 | 16,077 | 11,659 |
Source: consolidated statements across filings; older years from the standardized feed [10] [1] [11] [2]. Click any linked figure to open the filing page with the row highlighted.
Operating KPIs
| KPI | FY2021 | FY2022 | FY2023 | FY2024 | FY2025 |
|---|---|---|---|---|---|
| Total customer relationships | — | — | — | 32,214,000 | 31,846,000 |
| Total Internet customers | — | — | — | 30,083,000 | 29,680,000 |
| Total mobile lines | — | — | — | 9,858,000 | 11,766,000 |
| Total video customers | — | — | — | 12,892,000 | 12,605,000 |
Source: company-reported operating metrics [14]. Click any linked figure to open the filing page with the row highlighted.
Analyst Consensus
Mean target
Median target
High target
Low target
Street ratings: 5 strong buy, 11 hold, 2 sell, 3 strong sell. Consensus: Hold.
Estimate source: S&P Capital IQ (CapIQ) consensus, as of 2026-07-25. Estimate figures are S&P Capital IQ consensus (vendor data — no filing page links). EPS and net income use the normalized (adjusted) consensus where the street reports it. Line-item analyst models (segments, drivers, KPIs) are in the Visible Alpha tab.
Traceability
400 of 418 figures on this page (96%) link to the filing page where they are printed — click a linked figure to open the source PDF at that page with the row highlighted. Unlinked figures come from standardized data feeds or pre-filing years.
Each fiscal year FY2021–FY2025 is cited to its own Form 10-K, where that year is the first (current) reporting column of the consolidated statements.
Revenue by product line uses Charter's current disaggregation from the FY2025 Form 10-K (Note 14), which added a Connectivity subtotal and split commercial revenue into Small business and Mid-market large business. Charter restated FY2023–FY2024 onto this basis; FY2021–FY2022 are not presented on the current basis and are left blank in the revenue breakdown (their full income statement, balance sheet and cash flow are shown and cited to the FY2021/FY2022 10-Ks).
In the Long-Term Record, FY2016–FY2018 are from the standardized SEC XBRL data feed and shown without page links; FY2019–FY2020 are cited to the comparative columns of the FY2021 Form 10-K, and FY2021–FY2025 to each year's own 10-K.
The standardized data feed ties to the filed statements across revenue, operating income, net income, total assets, long-term debt, operating cash flow and capex for FY2021–FY2025 with no material discrepancies.
Quarterly income-statement and balance-sheet figures are cited directly to the FY2025 10-Qs and the Q1 FY2026 10-Q (Q4 FY25 income from the 2026-01-30 earnings 8-K; Q4 FY25 balance sheet from the FY2025 10-K year-end statement). Quarterly single-quarter cash flows are derived from the printed year-to-date statements and reconcile to the SEC XBRL quarterly feed.
Charter reports in US$ millions; all values are as printed except per-share (US$) and share counts (absolute).
1 figure(s) differed between the data feed and the filing; the filing value is shown (see the run's metrics/metrics_tab.json for the audit trail).
Charter Communications, Inc.'s management answers for the business every quarter. These are the exchanges that explain it best — verbatim, from the call transcripts preserved in Sources. Each link opens the full transcript at that page in a new tab.
Q1 2026 Earnings Call — Q1 2026
Charter's clearest current read on why broadband is stalling ('a top-of-funnel issue'), the Cox integration playbook, and the coming free-cash-flow surge as capex rolls off. · Open the full transcript →
The capex cliff underwriting the equity story: run-rate capex below $8B by 2028, worth over $28/share of free cash flow.
Jessica Fischer (Chief Financial Officer): We continue to expect total 2026 capital expenditures to reach approximately $11.4 billion. Looking beyond 2026, we expect total capital spending in dollar terms to be on a meaningful downward trajectory. And after our evolution and expansion capital initiatives conclude, our run-rate capital expenditures should be below $8 billion per year. Just to highlight that reduction in capital expenditures, on its own, from approximately $11.7 billion in 2025 to less than $8 billion in 2028, is equivalent to over $28 of free cash flow per share based on today's share count. If we take consensus 2026 free cash flow and substitute our expected 2028 CapEx for 2026 CapEx, our current stock price would imply a free cash flow multiple of only about 3.8x, and a free cash flow yield of over 25%.
p. 4 · Read in context →
Appetite for more cable M&A, and the regulatory framing: cable operators are regional players competing against national rivals.
Chris Winfrey (President and CEO); Sean Diffley (Morgan Stanley): We'd like to acquire more cable assets if it can be done at an appropriate price and terms, and the size of the transaction will drive higher synergies. […] At the end, we're just regional competitors with other cable companies. Each of the cable companies is a regional competitor. We don't have overlap and all of us are competing against national and global competitors. That's never been the case more than it is today.
p. 6 · Read in context →
Diagnosing the broadband stall: yield at point of sale is as strong as ever and churn is at record lows — the problem is the top of the funnel.
Chris Winfrey (President and CEO); John Hodulik (UBS): Our issue right now really is a top-of-funnel issue. What do I mean by that? Our yield at the point of sale is as strong as ever. Our churn remains at historical lows, and that's really supported by the value of the products and everything that we're doing to bundle in, which is driving churn lower. The external factors on top of that funnel are really the same: we have new competition, and any form of new competition has impact.
p. 9 · Read in context →
On the LEO satellite threat: no material share loss so far, and possibly 'more friend than foe' as a rural complement.
Chris Winfrey (President and CEO): On satellite, I would just say we don't underestimate any competitor, particularly one that is as well capitalized and innovative as these players. But so far, our tracking in data doesn't suggest a significant customer share loss to satellite. […] We've already integrated 5G as backu service through Invincible WiFi; there are other ways to attach satellite and possibly resell that product as part of our offerings. So we keep a close eye on it, and so far we don't see a major impact; it could be more friend than foe.
p. 9 · Read in context →
Q2 2025 Earnings Call — Q2 2025
The strategic-expansion call: the case for buying Cox, a new T-Mobile business MVNO, and the milestone that mobile turned free-cash-flow positive. · Open the full transcript →
A quiet inflection: mobile EBITDA-less-capex turned positive, making the fastest-growing line a free-cash-flow tailwind.
Christopher L. Winfrey (President and CEO): From a financial perspective, mobile EBITDA less mobile CapEx is positive. And for the last couple of quarters, that figure has been positive, even including the impact of customer device financing. Outside of our multiline phone balance buyout, we don't see a need to subsidize acquisition given our market-leading speed and value. So the mobile business is now becoming a real tailwind to our free cash flow growth, and it will continue to increase.
p. 2 · Read in context →
Tax reform's windfall: the restored depreciation and interest rules add roughly $10/share of free cash flow a year for six years.
Jessica M. Fischer (Chief Financial Officer); John Hodulik (UBS): I mean I think the big story is around sort of what it does to overall free cash flow. And in our modeling, the new rules can drive $10 or so of free cash flow per share for each of the next six years. So I think the impact is pretty dramatic.
p. 7 · Read in context →
Q3 2024 Earnings Call — Q3 2024
Where Charter laid out its 'Life Unlimited' relaunch — lower-priced bundles with multi-year price locks, a service guarantee, and 'seamless entertainment' bundling streaming apps into video. · Open the full transcript →
The Life Unlimited pricing reset spelled out: $40 gig when bundled, two- and three-year price locks, top products included.
Christopher Winfrey (President and CEO): Our new pricing and packaging will drive more sales with higher selling of our best products, grow customer ARPU despite lower product pricing, and reduce billing, service, and retention calls, while reducing churn. For example, we now offer our gig internet product at $40 per month when bundled with two unlimited mobile lines and/or video. Customers that take the new double play will receive a two-year price lock, and customers that take our new triple play will receive a three-year price lock. In that package, customers also get our top mobile tier, Xumo, and Cloud DVR at no additional charge.
p. 2 · Read in context →
Seamless entertainment: up to $80/month of retail streaming apps bundled free into video to make the linear product sticky again.
Christopher Winfrey (President and CEO): By early 2025, we'll be providing our TV Select customers up to $80 per month of retail streaming app value at no additional cost, including the ad-supported versions of Max, Disney+, Peacock Premium, Paramount+, ESPN+, AMC+, Discovery+, BET+, and ViX.
p. 2 · Read in context →
Sizing the ACP shock: about 200,000 internet losses from the subsidy's end, with the vast majority of former recipients retained.
Jessica Fischer (CFO): The end of the ACP program drove higher third quarter non-pay and voluntary churn among former ACP customers for a total estimated third quarter impact of approximately 200,000 internet losses. Incremental non-pay disconnects drove more than half of those losses, and the rest of the impact was primarily driven by voluntary churn with a small impact from lower connects. We continued to do a very good job in managing the end of the program, and we've retained the vast majority of our customers who were previously receiving an ACP benefit.
p. 3 · Read in context →
The core operating bet in one line: lower product prices lift customer ARPU, extend customer life, and lower cost to serve.
Jessica Fischer (CFO); Christopher Winfrey (President and CEO): Maybe the one early item to point out is that the bundled strategy we rolled out in new pricing is driving the results we hoped for. This should collectively drive higher customer ARPU by encouraging customers to take higher-tiered packages and more products. […] It's the old strategy that you can lower your product pricing and have higher customer ARPU, both at the sale and over time, resulting in longer customer lives and lower operating costs, which drives better returns.
p. 8 · Read in context →
Q3 2023 Earnings Call — Q3 2023
The pivot call: the Disney/ESPN carriage fight and Charter's new 'hybrid' video model, plus an early frame for the rural-build value engine. · Open the full transcript →
The line in the sand with programmers: modernize every carriage deal, and drop channels that make customers 'pay twice.'
Chris Winfrey (President and CEO): We plan to modernize all of our distribution agreements upon renewal in a way that works for customers. That means packaging flexibility, value and not asking customers or us to pay twice for similar DTC and linear programming. If programmers insist on customers paying twice, we just won’t carry those channels. But we’d still be happy to sell their content in an à la carte app, same way as they do.
p. 2 · Read in context →
The cost of the Disney blackout: about 100,000 video disconnects, softened because customers had over-the-top alternatives.
Jessica Fischer: Video customers declined by 327,000 in the third quarter, with about 100,000 video disconnects driven by the Disney programming dispute. The overall impact to customer relationships was less than we expected, facilitated in part by the wide availability of over-the-top alternative.
p. 3 · Read in context →
Why bother fixing video: for the first time in 15 years, a path to create customer value that props up the connectivity bundle.
Chris Winfrey (President and CEO); Jonathan Chaplin (New Street Research): So if I step back from a video perspective, again, I’m not forecasting growth, but the past 15 years, there’s been very little to be optimistic about, either from a customer perspective because of what the programmers have done or for ourselves as a distributor. And for the first time, I see a path where we can create value for customers and create utility and that ultimately will enhance the value of the connectivity services that we provide through our seamless connectivity in Spectrum One, which we’re beginning to market now as part of Xumo.
p. 7 · Read in context →
Convergence economics: free first mobile lines roll to $30 and stick, because the product can't be matched elsewhere.
Chris Winfrey (President and CEO); Steven Cahall (Wells Fargo): The mobile retention, we’re not having to do much of anything at all, simply because these lines are being actively used. They have similar port in rates to what we have elsewhere. […] But they go from a first line at $0 to $30, and that product is the fastest mobile product in the country, and it’s providing it at the lowest rate relative to that speed. So, at $30, you can’t replicate that mobile product anywhere else in the country that’s producing that speed.
p. 12 · Read in context →
More calls
Q4 2025 Earnings Call — Q4 2025 · 10 pages · The full-year 2025 wrap-up and 2026 outlook: capital-allocation and guidance philosophy heading into the Cox close. · Open →
Q3 2025 Earnings Call — Q3 2025 · 13 pages · Continued traction on the new pricing and packaging and progress on Cox integration planning ahead of close. · Open →
Q1 2025 Earnings Call — Q1 2025 · 10 pages · The pre-Cox baseline: early read on Life Unlimited bundle traction and the post-ACP broadband trend, framed largely through a single deep Craig Moffett exchange. · Open →
Q4 2024 Earnings Call — Q4 2024 · 12 pages · The first full multiyear capex outlook after Life Unlimited — network-evolution rephasing and the Liberty Broadband deal context. · Open →
Q2 2024 Earnings Call — Q2 2024 · 12 pages · The ACP-cliff quarter: a 149,000 internet loss and management's first detailed framing of the subsidy wind-down. · Open →
Q1 2024 Earnings Call — Q1 2024 · 11 pages · Pre-shock detail on network evolution and Spectrum One convergence while broadband was still growing. · Open →
Q2 2023 Earnings Call — Q2 2023 · 14 pages · The pre-Disney baseline where the original multiyear strategy — network evolution, rural expansion, convergence — was still being established. · Open →
Charter Communications, Inc.'s annual reports contain management's most considered account of the business. These are the sections, passages and visual pages worth opening in the originals preserved in Sources.
Charter Communications, Inc. — FY2025 Annual Report (Form 10-K) — FY2025
Management's fullest account of the Spectrum broadband business on the eve of its transformative Cox and Liberty Broadband deals. · Open the full document →
Item 1. Business — p. 7 · Read the full section →
Management's own framing of what the company is, what it sells, and the convergence strategy behind it.
The business in one paragraph: a Spectrum broadband operator serving 58 million homes across 41 states, and its convergence strategy.
We are a leading broadband connectivity company with services available to 58 million homes and small to large businesses across 41 states through our Spectrum brand. Founded in 1993, we have evolved from providing cable TV to streaming, and from high-speed Internet to a converged broadband, WiFi and mobile experience. […] Our strategy is focused on utilizing our fiber-powered network to deliver high-quality, competitively priced products, with outstanding service, allowing us to increase both the number of customers we serve over our network and the number of products we sell to each customer. This combination also reduces the number of service transactions we perform per relationship, yielding higher customer satisfaction and lower customer churn, which results in lower costs to acquire and serve customers and drives greater profitability.
p. 7 · Read in context →
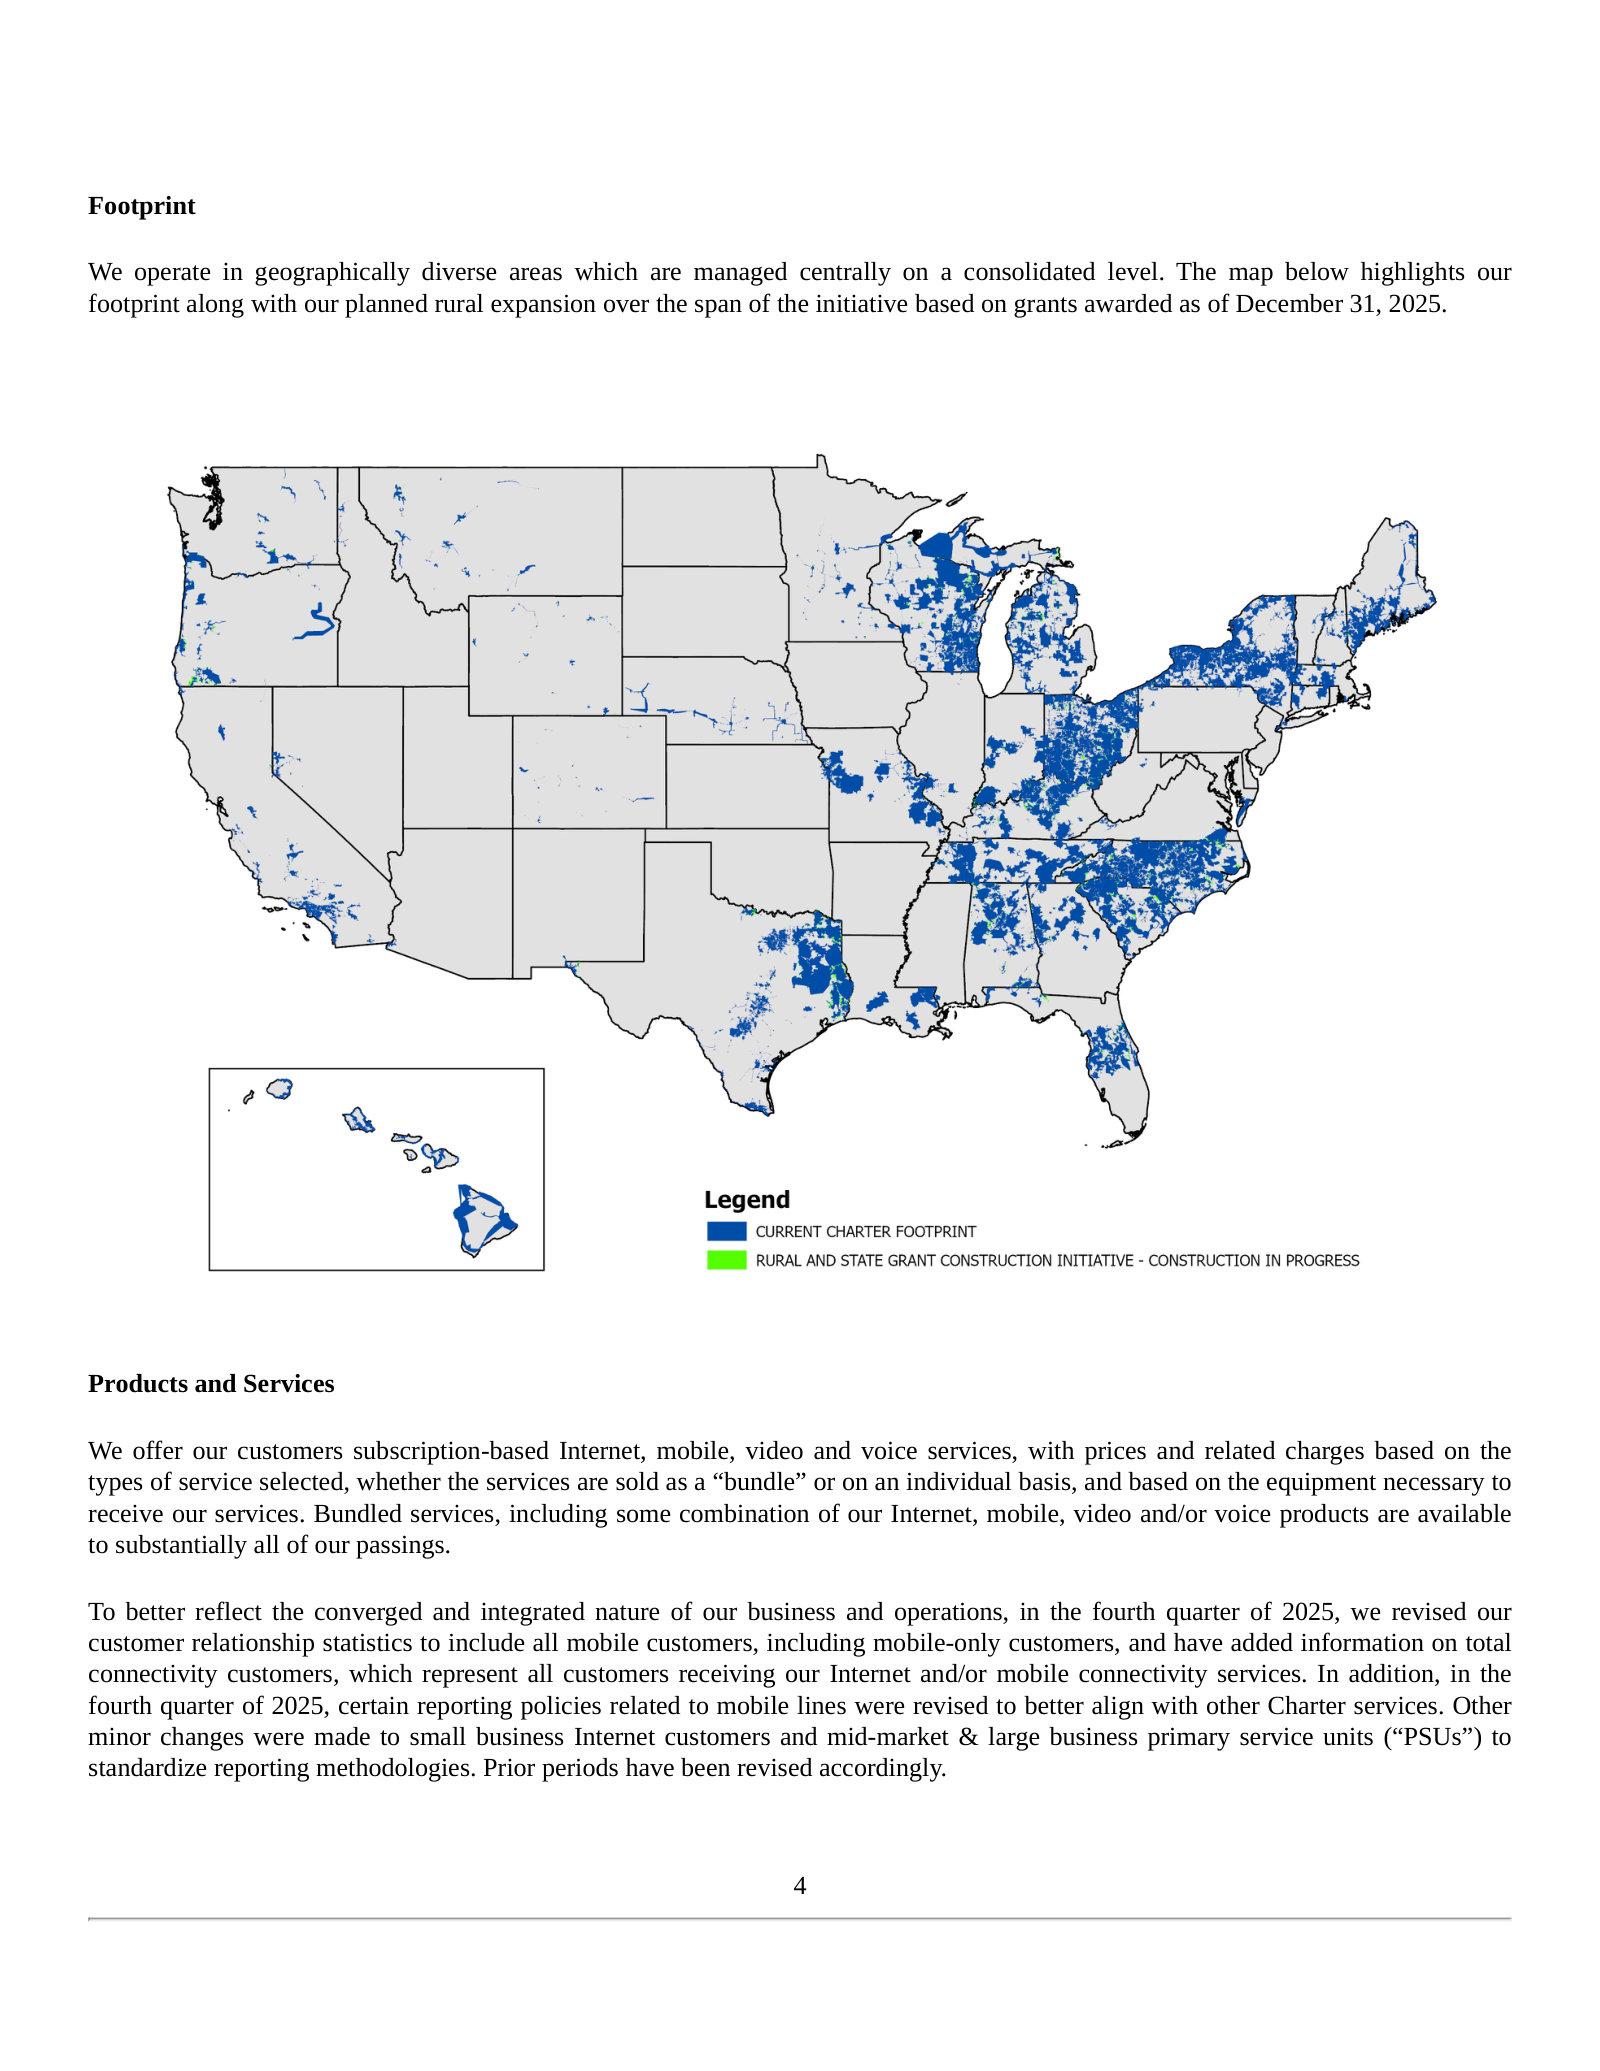
Products and Services — Residential Connectivity — p. 15 · Read the full section →
Shows how the money is actually made — the Internet-plus-mobile bundle and the network partnerships behind Spectrum Mobile.
How the bundle works: Spectrum Mobile rides Verizon's network, with a 2025 T-Mobile deal added for business customers.
Our Spectrum Mobile service is offered to customers subscribing to our Internet service and uses the customers’ private WiFi, our Spectrum Mobile network (comprised of 49 million out-of-home WiFi access points across our footprint combined with out-of-home WiFi access points from other networks with which we partner) as well as leveraging the cellular network of Verizon Communications Inc. ("Verizon"). We leverage the Verizon cellular network to provide nationwide coverage including unlimited calls, text and data using Verizon’s fourth generation and fifth generation (“5G”) service including their latest 5G technology. […] In addition, in July 2025, we entered into a multi-year agreement with T-Mobile US, Inc. (“T-Mobile”) to use their network to deliver mobile services to Spectrum Business customers which is set to launch in 2026.
p. 15 · Read in context →
Competition — p. 27 · Read the full section →
The central investment question for cable: how much of the footprint fiber and fixed-wireless rivals can take.
Internet competition: national telco fiber overbuilds roughly 27% and 16% of the footprint, alongside fixed-wireless and satellite.
Our residential Internet service faces competition across our footprint from fiber-to-the-home ("FTTH"), fixed wireless broadband, Internet delivered via satellite and DSL services. […] AT&T Inc. ("AT&T") and Verizon are our primary FTTH competitors. We face terrestrial broadband Internet (defined by the Federal Communications Commission (“FCC”) as at least 100 Mbps) competition from AT&T and Verizon in approximately 27% and 16% of our operating footprint, respectively.
p. 27 · Read in context →
Liberty Broadband Combination and Cox Transactions — p. 31 · Read the full section →
The two deals that reshape the company — scale, ownership, and leverage all change here.
The Cox Transactions: Charter to combine with Cox Communications' residential cable and commercial fiber businesses.
On May 16, 2025, Charter, Charter Holdings, and Cox Enterprises, Inc. (“Cox Enterprises”) entered into a Transaction Agreement (the “Transaction Agreement”) pursuant to which (i) Cox Enterprises will sell and transfer to Charter 100% of the equity interests of certain subsidiaries of Cox Communications, Inc. (“Cox Communications”) that conduct Cox Communications’ commercial fiber and managed IT and cloud services businesses (the “Equity Sale”), (ii) Cox Enterprises will contribute the equity interests of Cox Communications and certain other assets (other than certain excluded assets) primarily related to Cox Communications’ residential cable business to Charter Holdings (the “Contribution”), and (iii) Cox Enterprises will pay $1.00 to Charter (collectively, the “Cox Transactions”).
p. 31 · Read in context →
Item 1A. Risk Factors — p. 44 · Read the full section →
The two company-specific risks that could genuinely bite: a heavy, growing debt load and a concentrated, governance-rich shareholder base.
Leverage is the defining risk: about $94.6 billion of principal at 4.15x EBITDA, with more debt to fund and assume in the Cox deal.
We have a significant amount of debt, with total principal amount of approximately $94.6 billion and a leverage ratio of 4.15 times Adjusted EBITDA as of December 31, 2025. […] As part of the Cox Transactions, Charter will fund the $4.0 billion of cash consideration using debt and will assume Cox Communications' approximately $12.6 billion of net debt and finance leases.
p. 52 · Read in context →
Item 7. MD&A — Overview and Results of Operations — p. 80 · Read the full section →
Where management explains what actually drove the year — mobile growth against Internet and video pressure.
What drove 2025: 1.9 million mobile lines added while Internet and video losses eased on lower churn.
During the year ended December 31, 2025, we added 1.9 million mobile lines while Internet and video losses improved as compared to the prior year period. Sales were challenged by the competitive environment but were offset by lower customer churn.
p. 80 · Read in context →
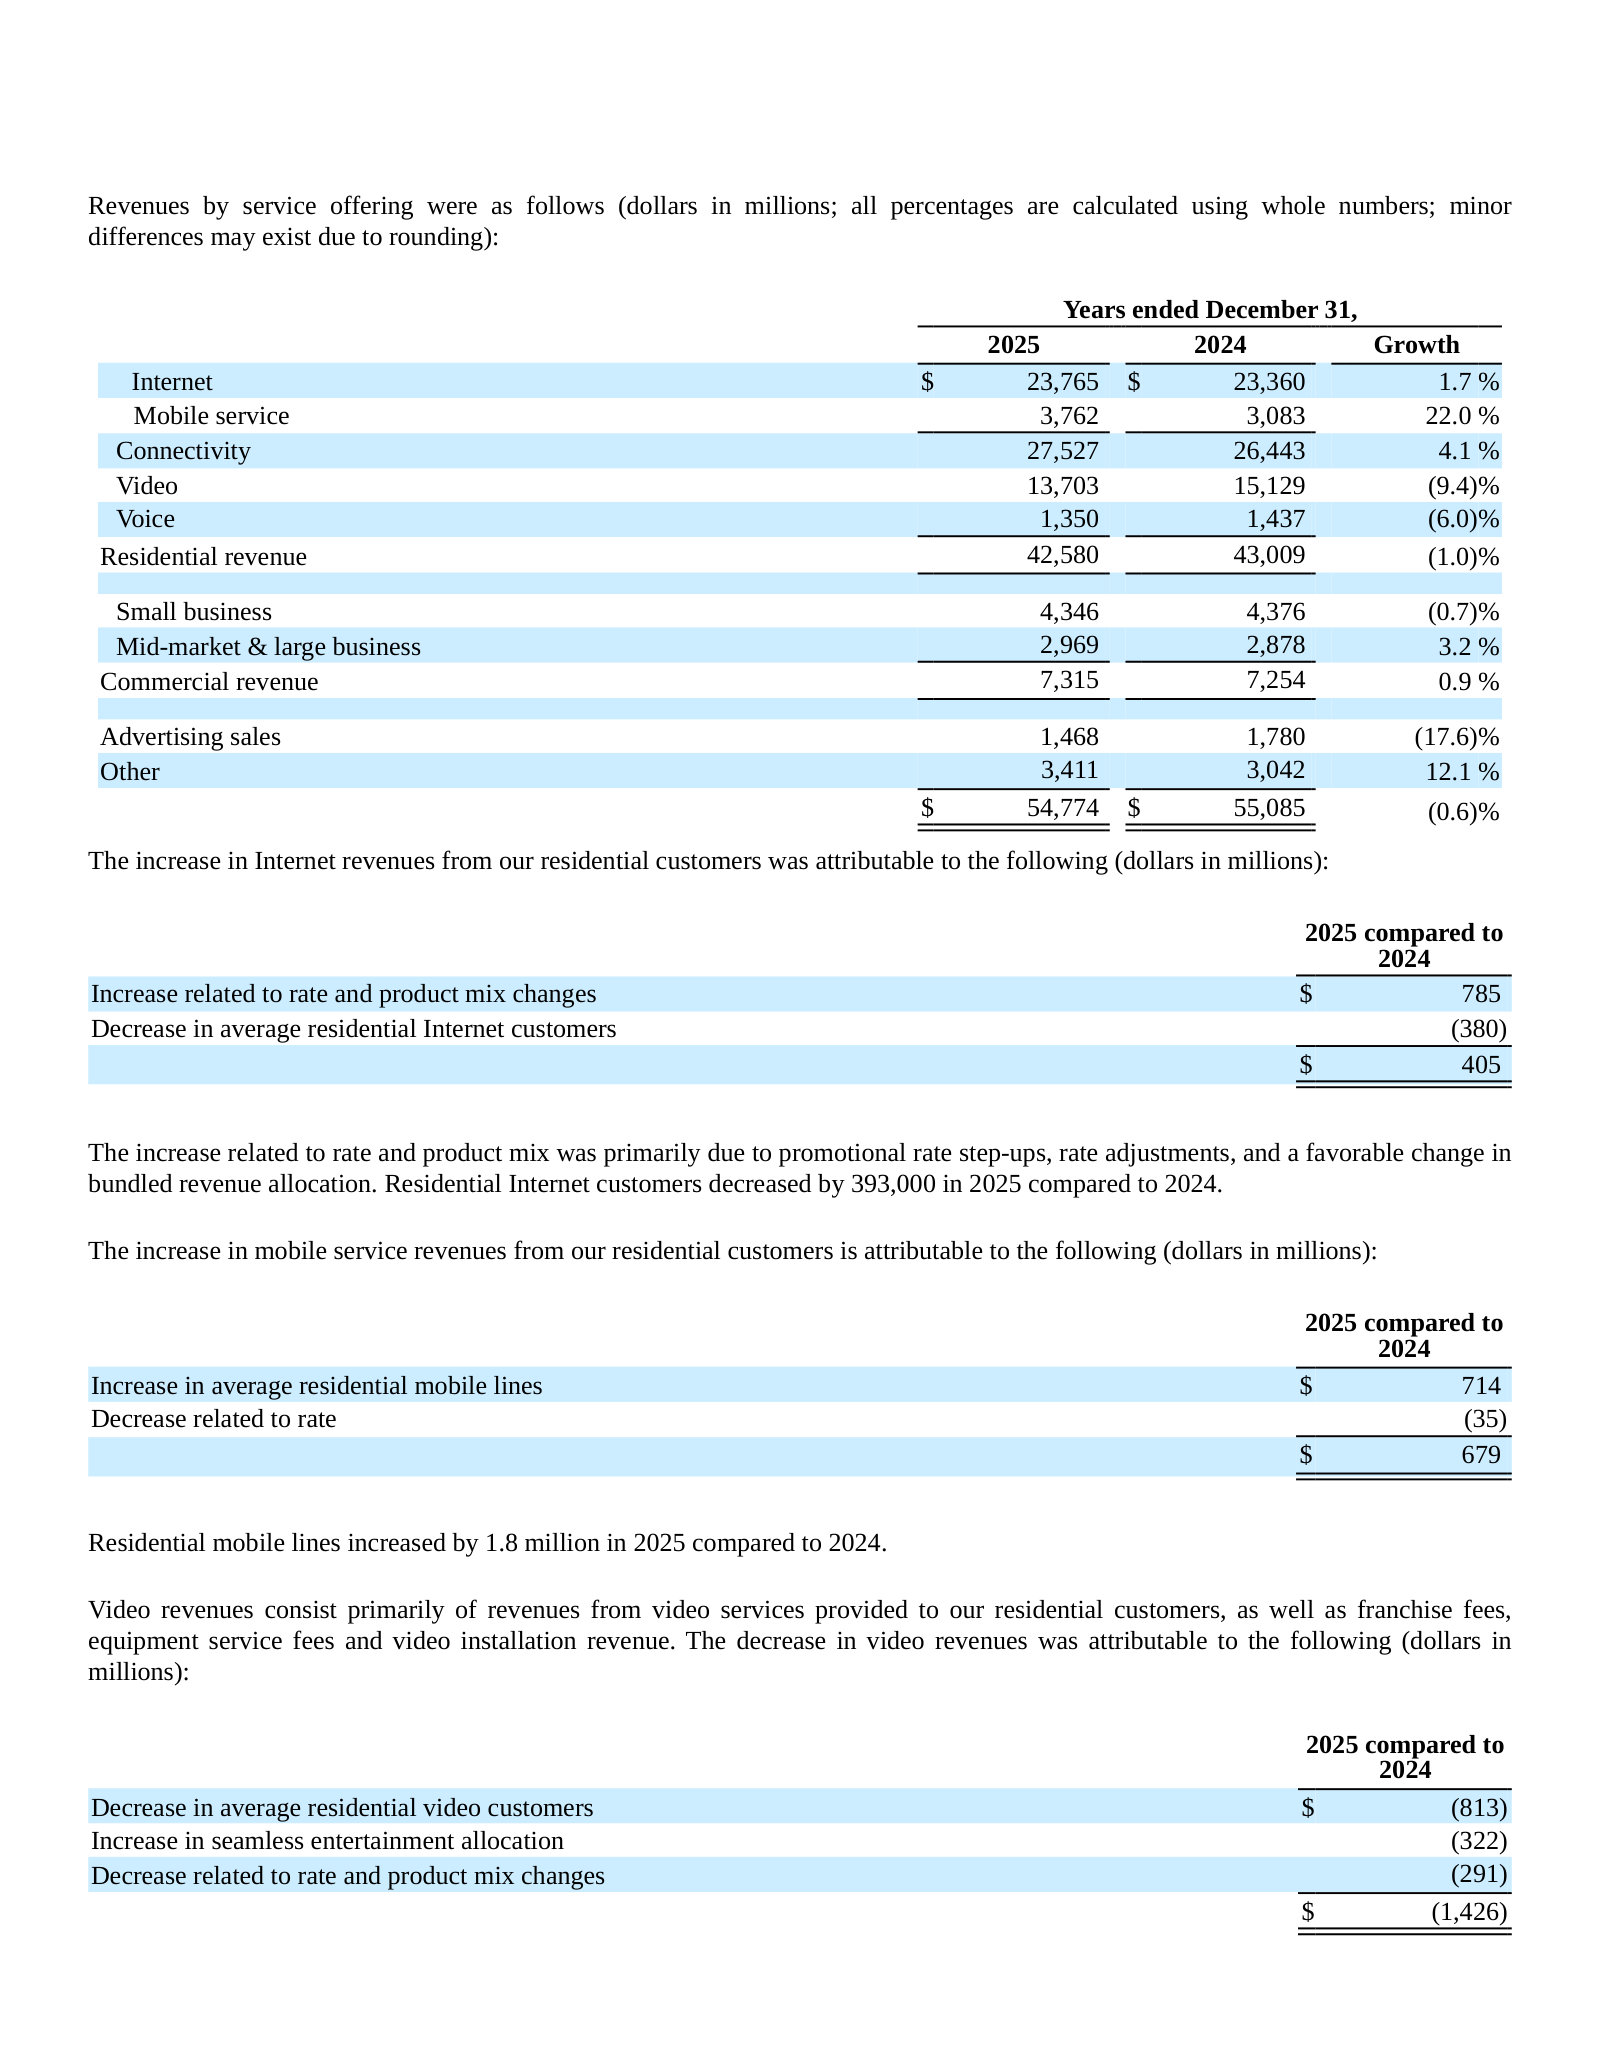
Critical Accounting Policies — Valuation and Impairment of Franchises and Goodwill — p. 84 · Read the full section →
The accounting choice that defines the balance sheet: indefinite-lived franchise rights that dwarf everything else.
Balance-sheet oddity: $67.5 billion of indefinite-lived franchise rights are 44% of assets, tested for impairment but never amortized.
The carrying value of franchise intangibles as of both December 31, 2025 and 2024 was approximately $67.5 billion (representing 44% and 45% of total assets, respectively), and the carrying value of goodwill as of both December 31, 2025 and 2024 was approximately $29.7 billion (representing 19% and 20% of total assets, respectively). […] We have concluded that all of our franchises qualify for indefinite life treatment given that there are no legal, regulatory, contractual, competitive, economic or other factors which limit the period over which these rights will contribute to our cash flows.
p. 84 · Read in context →
Use of Adjusted EBITDA and Free Cash Flow — p. 94 · Read the full section →
The non-GAAP measures Charter is run and lent against — read them before any headline EPS figure.
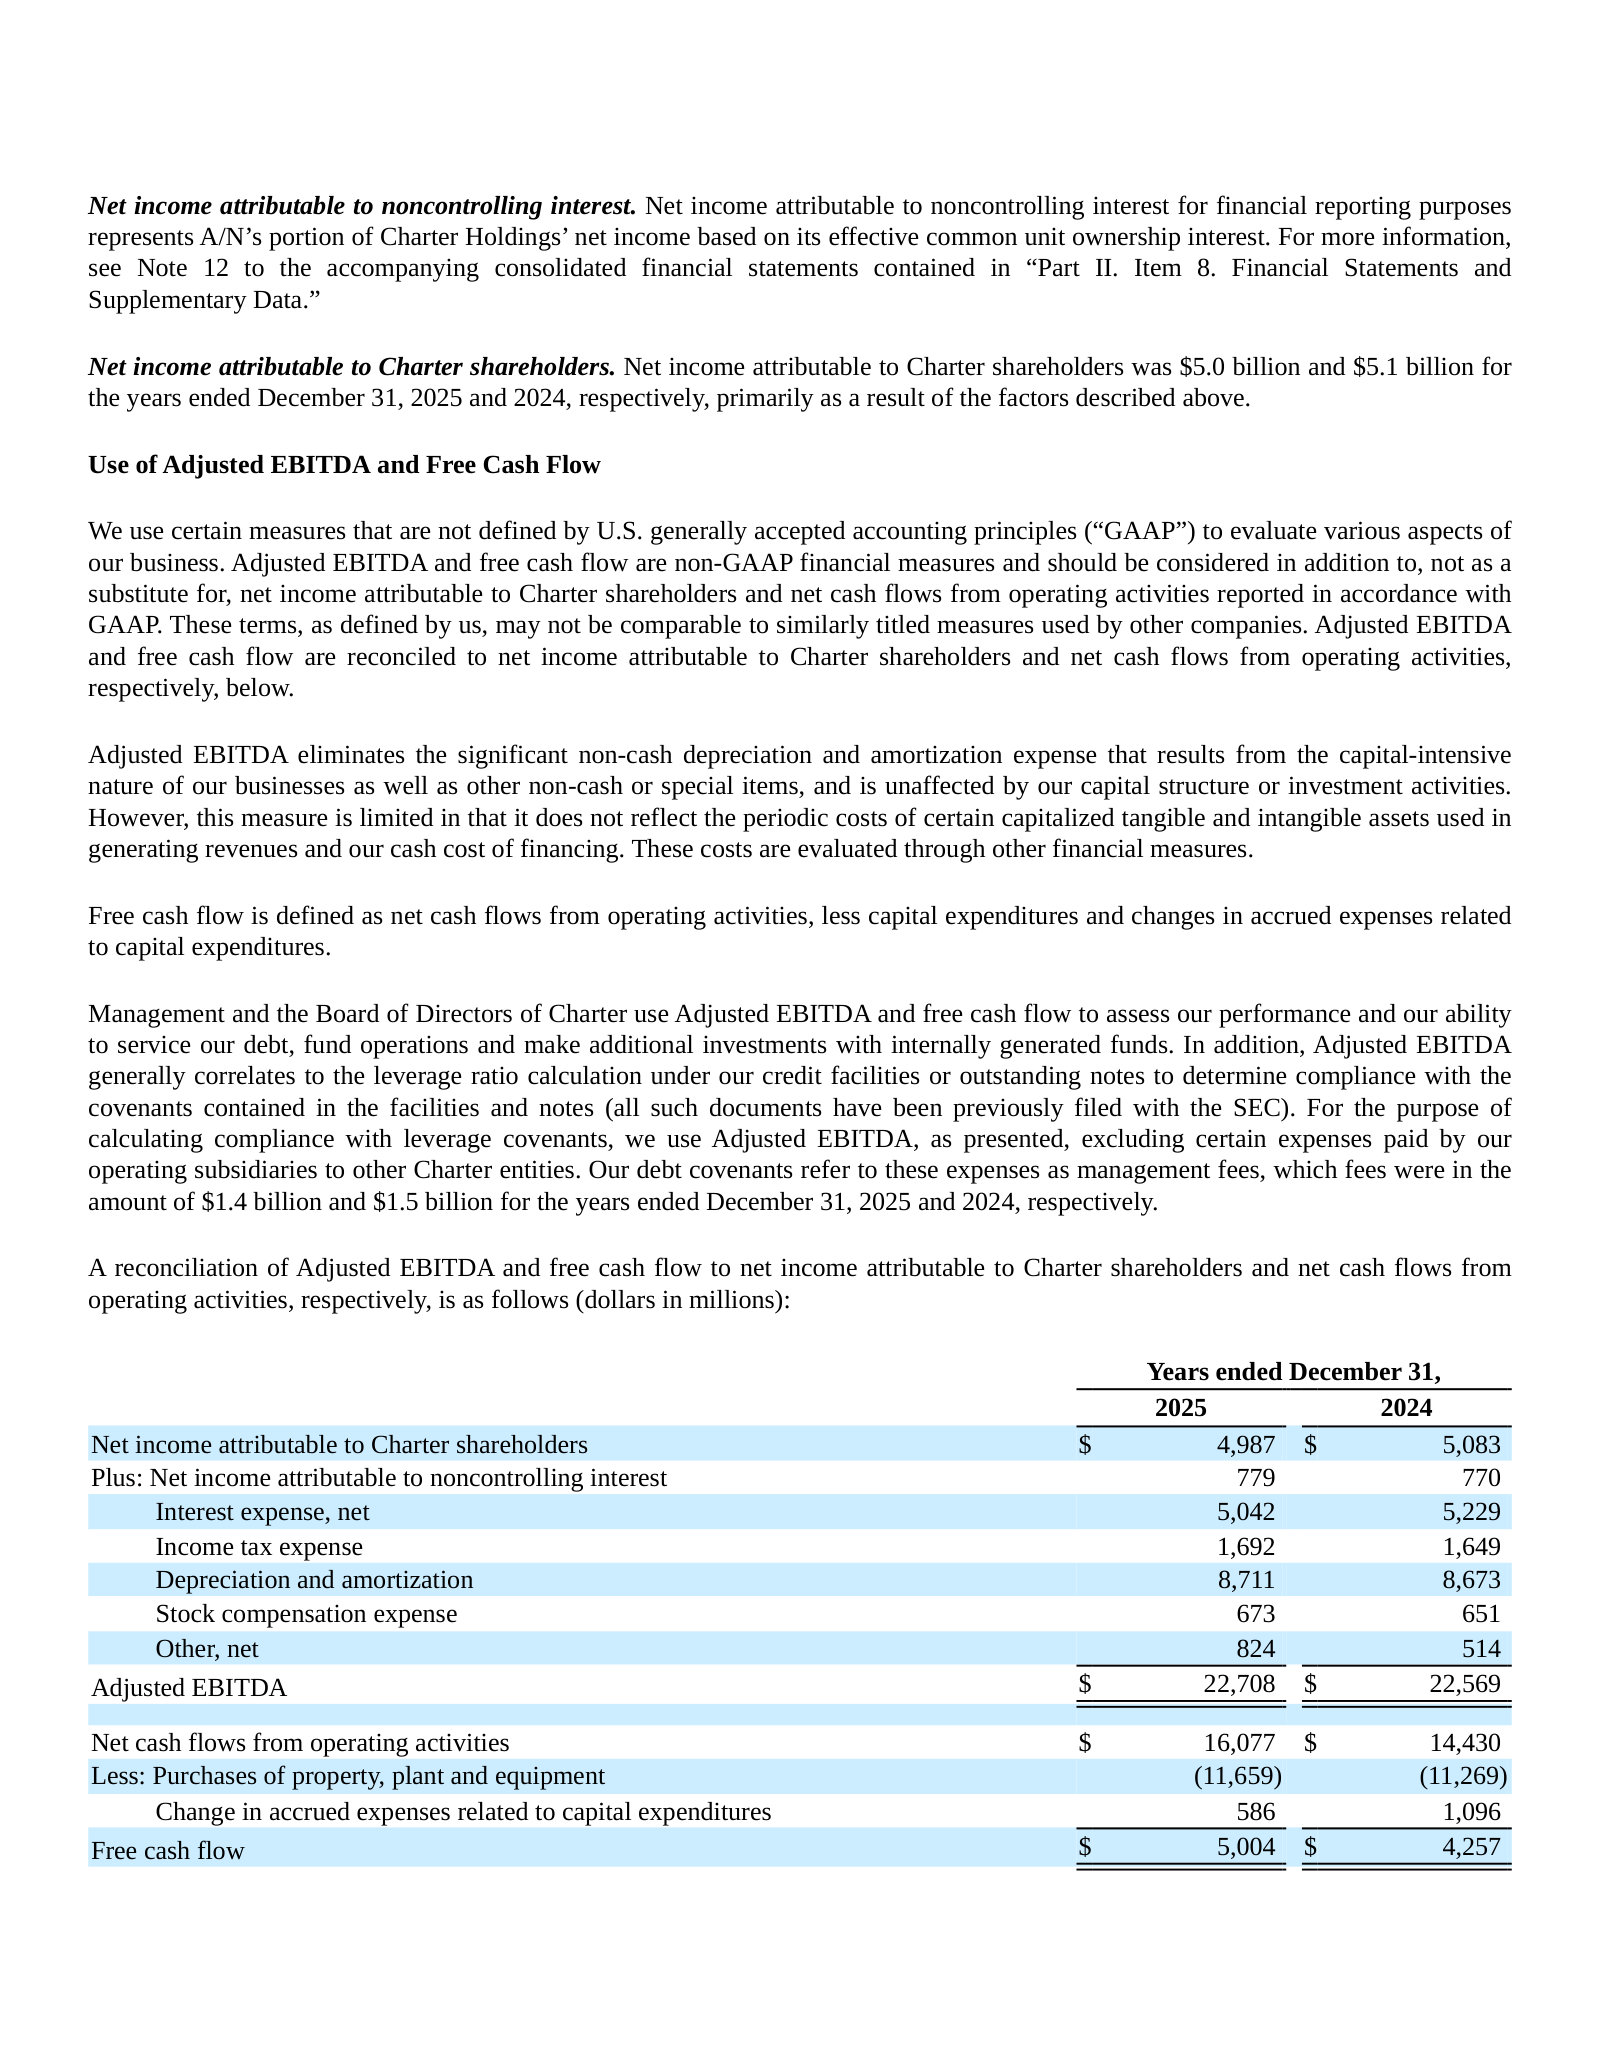
More annual reports
Charter Communications, Inc. — FY2024 Annual Report (Form 10-K) — FY2024 · 183 pages · Prior-year 10-K; the first to detail the November 2024 Liberty Broadband merger agreement, before the Cox deal was signed. · Open →
Charter Communications, Inc. — FY2023 Annual Report (Form 10-K) — FY2023 · 174 pages · Pre-deal baseline: mobile still scaling and the network-evolution plan freshly laid out. · Open →
Charter Communications, Inc. — FY2022 Annual Report (Form 10-K) — FY2022 · 165 pages · Captures the shift to converged connectivity and the early Spectrum Mobile ramp. · Open →
Charter Communications, Inc. — FY2021 Annual Report (Form 10-K) — FY2021 · 181 pages · Earlier edition, useful for how the business was framed before mobile and convergence took center stage. · Open →
Competitors describe Charter Communications, Inc.'s market in their own filings and calls. These verified passages and visual pages show where their strategies meet, using source documents preserved in Sources.
Comcast Corporation (CMCSA)
Charter's structural mirror image: the other large US cable operator running the same broadband-video-plus-MVNO model. The two do not overlap geographically and even partner (Xumo, joint MVNO procurement, seamless Wi-Fi), yet Comcast sizes the same converged-connectivity opportunity, reports the mobile and broadband trends Charter benchmarks against, and describes the identical fiber-and-FWA threat map.
Comcast reports its best-ever wireless quarter (378,000 lines, Xfinity Mobile at ~14% of its broadband base) and discloses a new T-Mobile MVNO for business customers struck jointly with Charter — a reminder that the two non-overlapping cable operators pool scale to procure mobile capacity while running the same broadband-plus-MVNO convergence model.
Michael J. Cavanagh, CEO: Momentum is building in wireless as well. Our free line offer and solid uptake in our new premium unlimited plans helped drive our best quarter ever with 378,000 new lines added, bringing Xfinity Mobile to 14% penetration of our residential broadband base and still leaving us with plenty of room to run. […] Just last week, we announced a new MVNO agreement with T-Mobile in partnership with Charter. This new agreement pairs our industry-leading broadband and WiFi with T-Mobile's 5G network to expand our mobile product offer to business customers as a fully integrated solution. We are pleased to work with T-Mobile in this initiative and continue to value our strong partnership with Verizon.
p. 1 · Read in context →
Comcast frames wireless as the engine of its convergence strategy — roughly 1.5 million net lines added in 2025 to over 9 million total at ~15% penetration of its broadband base — and confirms it modernized the shared Verizon MVNO benefiting Comcast, Charter and Verizon, the same capital-light mobile economics Charter's Spectrum Mobile relies on.
Michael J. Cavanagh, Co-CEO: Turning to wireless, I am pleased to share that we have modernized our MVNO partnership with Verizon, supporting continued profitable growth for Comcast Corporation, Charter, and Verizon. With these enhancements, we have an even stronger relationship with Verizon to enable our customers to have a world-class experience. With the addition of T-Mobile as a network partner for our business customers later in the year, we continue to have a capital-efficient mobile platform with a cost structure that supports a durable and growing convergence value proposition for our customers. Wireless continues to be a powerful driver of that convergence strategy, and 2025 was our strongest year yet. We added approximately 1,500,000 net lines, ending the year with over 9,000,000 total lines and roughly 15% penetration of our residential broadband base. That performance reinforces wireless as a key growth engine for the company while also strengthening customer relationships and lifetime value across our connectivity portfolio.
p. 2 · Read in context →
Comcast's CFO lays out the cable industry's shared view of the competitive map that Charter also faces: fiber overbuild toward 'two wires' across most territory plus a permanent but value-conscious, 'niche' role for fixed wireless — while committing to 1.2 million new homes passed a year and DOCSIS 4.0 network upgrades.
Jason S. Armstrong, CFO: we are building out 1.2 million homes per year. We've done that. We're on pace to do that this year, did this last year. If you really step back, this is a validation of how we see ultimately the market for broadband, right? And we're in a competitive period right now. Not sure we expect that to change. Fiber will continue to be built out against us. Fixed wireless is going to continue to have sort of a niche it carves out in the valueconscious world. When we build new homes, though, it is against a framework that the competition of the future will involve two wires coming into the vast majority of the territory that we serve in addition to fixed wireless having carved out a more permanent niche in the market. Despite that, we feel very comfortable competing in that sort of environment.
p. 11 · Read in context →
T-Mobile US (TMUS)
The most aggressive attacker of the cable broadband franchise: T-Mobile's 5G Home Internet and new fiber JVs are framed explicitly as share taken from incumbents like Charter, and its 10-K names Charter as both a wireless and broadband competitor. Spectrum Mobile also competes with T-Mobile for the same wireless subscriber.
Asked about 'the cable story,' T-Mobile's CEO says cable is not a business it wants to own and frames the strategy as attacking incumbents through fiber and fixed wireless — the posture behind the 5G home-internet push that takes share from cable broadband operators such as Charter.
Srinivasan Gopalan, President and CEO: Kannan, it just struck me that your reference to large deals potentially was you asking the question I get asked quite often, which is the cable story. As I've said before, we're not going to go do scale for scale's sake. Specifically, cable is not something we're interested in. We see our strength as attacking incumbents rather than becoming an incumbent. We see a huge opportunity to attack incumbents across fiber and fixed wireless access. That will be our key play.
p. 8 · Read in context →
T-Mobile's FY2025 10-K Competition section names Charter Communications among its wireless competitors and lists Cable and Fiber broadband providers as competitors to its own fixed-wireless and fiber broadband — putting Charter on both the mobile and broadband sides of T-Mobile's competitive map.
The telecommunications industry remains competitive. We are the second largest provider of wireless communications services in the U.S. as measured by our total postpaid and prepaid customers. Our wireless communications services competitors include other carriers, such as AT&T Inc. (“AT&T”) and Verizon Communications, Inc. (“Verizon”). In addition, our wireless communications services competitors include numerous smaller and regional providers, including Charter Communications, Inc., Comcast Corporation EchoStar Corporation (“EchoStar”), Cox Communications, Inc., and Altice USA, Inc., many of which offer no-contract, postpaid and prepaid service plans. Competitors also include providers who offer similar communication services, such as voice, messaging and data services, using alternative technologies. In addition to our wireless communications services, our broadband services compete against other broadband providers, including Cable, DSL and other Fiber broadband providers, other fixed wireless solutions, including AT&T and Verizon’s fixed wireless products, and satellite internet providers. Competitive factors within the telecommunications industry include promotions, pricing, market saturation, service and product offerings, customer experience, network investment and quality, development and deployment of technologies and changes in the regulatory environment that may affect market entry, pricing practices and network investment. Some of our competitors have shown a willingness to use discounted pricing or offer bundled services as a potential source of differentiation.
p. 13 · Read in context →
T-Mobile's 10-K risk factors name Charter directly as a cable MVNO wireless competitor and identify traditional cable providers as broadband rivals it is targeting with fixed wireless plus new fiber joint ventures — the two-front collision with Charter's Spectrum Mobile and Spectrum Internet.
We expect to continue to see intense competition in all market segments from traditional Mobile Network Operators (“MNOs”), such as AT&T and Verizon, who have each invested heavily in spectrum, their wireless networks, and services and device promotions. Numerous other regional MNOs and MVNOs offering wireless services may also compete with us in some markets, including cable providers, such as Comcast, Charter, Cox, and Altice, as they continue to diversify their offerings to include wireless services offered under MVNO agreements. As new products and services emerge, we may also face competition from non-traditional competitors outside the wireless communications services industry, including satellite providers offering connectivity services using alternative technologies.
In the market for broadband services, traditional cable providers, AT&T, Verizon, and other players such as satellite and fiber providers, all compete for customers. To complement our fixed wireless service, we have entered into joint venture agreements aimed at establishing a robust fiber wireline network in certain geographic regions that we believe will complement our fixed wireless services in those areas.
p. 21 · Read in context →
Verizon Communications (VZ)
A coopetitor on two fronts: Charter's Spectrum Mobile is an MVNO on Verizon's wireless network (agreement just renewed), while Verizon's Fios fiber and fixed-wireless broadband — enlarged by the Frontier acquisition — compete head-on with Spectrum Internet for home-broadband subscribers and push the same convergence bundle.
Verizon's CEO confirms a completed long-term wholesale renewal with Comcast and Charter — the network Charter's Spectrum Mobile rides on — calling it 'accretive' and framing it as keeping the cable operators' mobile customers 'on the best network,' underscoring both the coopetition and Verizon's wholesale leverage over Spectrum Mobile.
Daniel Schulman, Chief Executive Officer: I'm also very pleased to announce that we have completed a comprehensive long-term agreement with Comcast and Charter to continue our partnership. We obviously can't reveal any of the details, but each of us agrees the partnership is on very solid footing financially, operationally, and strategically. It is an accretive deal that ensures their customers remain on the best network.
p. 2 · Read in context →
Verizon positions fiber as a 'key differentiator against competitors who don't have it' — a reference to cable operators like Charter running HFC/coax plant — while claiming continued broadband share gains and a 55% wireless-to-broadband attach rate anchoring the convergence bundle it sells against Spectrum's internet-plus-mobile offer.
Daniel Schulman, Chief Executive Officer: In Q1, we continue to take broadband share. We have absolutely no intention to slow down; in fact, quite the opposite. We have a huge cross-sell opportunity. Only 20% of our base has broadband. […] There's no question we think that fiber is a key differentiator against competitors who don't have it. And I'd also point out that our attachment rate of wireless when a customer has broadband is, I think, best in the industry at 55% right now.
p. 9 · Read in context →
Verizon's FY2025 10-K names Charter Communications as a wholesale reseller riding Verizon's wireless network, then lists cable companies among the head-to-head competitors for its fiber and fixed-wireless broadband — capturing both sides of the coopetition in Verizon's own words.
We also compete for retail activations with resellers that buy bulk wholesale service from wireless service providers, including Verizon, and resell it to their customers. Resellers include cable companies, such as Comcast Corporation and Charter Communications, Inc., and others. Several major cable operators also offer bundles with wireless services through strategic relationships.
With respect to fiber, FWA and our other broadband services, we compete against cable companies, wireless service providers, domestic and foreign telecommunications providers, satellite television companies, low Earth orbit satellite companies, internet service providers, OTT providers, other internet portal providers and other companies that offer network services and managed enterprise solutions.
p. 11 · Read in context →
AT&T (T)
AT&T's fiber-and-fixed-wireless build plus its OneConnect convergence bundle attack the same converged broadband-and-mobile customer Charter targets. Management repeatedly names Charter, framing cable as priced higher with an inferior product, and quantifies fiber's footprint expansion and share gains.
Naming Comcast and Charter, AT&T's CEO argues fiber 'sits under their pricing umbrella,' giving AT&T more ARPU freedom, and that cable — priced higher with what he calls an inferior product — is the party having to readjust to the market. A pointed pricing-and-product attack on Charter's broadband ARPU, in AT&T's own framing.
Peter Supino, Analyst (Wolfe Research), question; John Stankey, Chairman and CEO, answer: Comcast and Charter are behaving differently in terms of the way they price existing customer broadband rates. And so I'm wondering how you're thinking about the price of fiber for your existing subs, your retail rate outlook? And then a question about FWA growth. Looking out two years, it looks like your DSL base will be gone if we just extrapolate recent decline rates. And I wonder in that scenario, should we expect FWA sales to hold up? And if so, should we worry about a supply-demand problem in high-capacity broadband as that DSL demand goes away and three powerful carriers continue to try to grow DSL? Thank you.
## John Stankey (CEO):
Look, I've said it before, I think we're in a distinctly different place in cable. One is we currently sit under their pricing umbrella. We're not at their levels. So we have a lot more degrees of freedom in how we manage our ARPUs and our various offers in the market than they have. So it's one thing, understand why they're having to make the changes they're making; they're priced higher and their products are inferior. And so they're the ones that are having to readjust to the market, not us. We've got the better product, we're priced lower. And that's why this is a problem for them.
p. 9 · Read in context →
AT&T quantifies the scale of its converged build into cable territory: 31 million fiber passings heading to 60 million by 2030, Internet Air fixed wireless across 47 states, best broadband net adds in eight years, and convergence attach of 41% of fiber households and over half of Internet Air households taking AT&T wireless — the fiber-plus-mobile bundle competing for Charter's broadband and mobile customers.
John Stankey, Chairman and CEO: At the end of the third quarter, we passed more than 31 million total locations with fiber, and we expect to reach more than 60 million customer locations by 2030. We also offer our fixed wireless service, AT&T Internet Air, in parts of 47 states, and we continue to expand availability into new areas as we open and modernize our mobile network. You can see the durable impact of these investments in our third quarter results, which include over 550,000 new subscribers to our most advanced broadband services, AT&T Fiber, and Internet Air. This resulted in our highest total broadband net adds in more than eight years. Let me say that again. We achieved our highest total broadband net adds in eight years. This includes a major milestone by reaching over 10 million premium AT&T Fiber subscribers, more than doubling our fiber customer base in less than five years and nearly tripling our quarterly fiber revenues over that same period, and the train keeps rolling. We offer fast and reliable connectivity for 5G and fiber at attractive price points, and more people are choosing AT&T Inc. for both wireless and home internet services. Today, more than 41% of AT&T Fiber households also choose AT&T Inc. for wireless. The pace of this convergence trend within our customer base continues to grow. These customers remain our most valuable, with the lowest churn profile and highest lifetime values. Our success with convergence also extends to fixed wireless. More than half of our Internet Air subscribers also choose AT&T Inc. for their wireless service.
p. 1 · Read in context →
Altice USA (ATUS)
Charter's closest small-cap cable peer, running the same HFC broadband-plus-Optimum-Mobile-MVNO model and facing the identical FWA-and-fiber squeeze. Its filings name Charter directly as a national overbuilder pushing fiber into Optimum's footprint, making the collision explicit rather than merely structural.
In its FY2025 10-K, Altice USA singles out Charter and Comcast as large national operators 'deploying significant fiber and network overbuilds' inside Optimum's markets — evidence, from a weaker cable peer's seat, that Charter's fiber overbuild and rural line-extension strategy is an offensive threat, not just a same-industry parallel.
In addition to smaller and regional overbuilders, which use an existing telecommunications operator's network to provide their services, as well as newer fiber providers such as Tachus and T-Fiber, large national providers such as Comcast and Charter are currently deploying significant fiber and network overbuilds in portions of our footprint, increasing the intensity of competition in certain markets.
p. 12 · Read in context →
Altice USA's CEO ties Q3 2025 broadband weakness to a September spike in fixed-wireless activity plus aggressive fiber-overbuilder promotions and marketing — the same twin FWA-and-fiber pressure and promotional arms race Charter cites for its own broadband subscriber losses, told from a smaller, more exposed operator.
Dennis Mathew, Chairman and CEO: Our results in the third quarter reflect shifting dynamics. The first part of the quarter was relatively stable, both against fixed wireless and fiber overbuilders. However, in September, competitive intensity significantly accelerated with aggressive offers paired with heightened marketing spend from our competitors, as well as elevated fixed wireless activity, which impacted our results. In the face of this, we remain disciplined by prioritizing financial stability and protecting margins over chasing lower-value gross additions. At the same time, we recognize that we must be bolder in our go-to-market and base management strategies to stabilize broadband performance.
p. 1 · Read in context →
Cable ONE (CABO)
A smaller, rural/exurban US cable broadband operator facing the same fiber-overbuild and fixed-wireless pressure as Charter, but earlier and more acutely given its low-density footprint. Its disclosures on overbuild penetration, the ARPU-versus-value-tier trade-off, and the long-run wired-versus-wireless share split map directly onto Charter's own broadband durability debate.
Cable ONE discloses that just under 60% of its footprint is now overbuilt by wired 100 Mbps-plus competitors, with 5G fixed wireless an added threat, and concedes it is loosening its long-standing high-value-customer discipline to chase 'value-conscious' subscribers — a move it admits will pressure broadband ARPU and margins. The same value-tier-versus-ARPU tension Charter navigates, framed here as defensive.
As of December 31, 2025, a little less than 60% of our footprint has been overbuilt by wired competitors offering highspeed data services with speeds of 100 Mbps or higher. Further overbuilding could cause more of our customers to purchase data and video services from our competitors instead of from us. We also face competition from various providers of wireless internet offerings, including cell phone internet providers that have deployed high-speed “5G” wireless networks where they have higher capacity spectrum and public locations or commercial establishments offering Wi-Fi at no cost. We also face increasing competition from wireless telephone companies for residential voice services, as our customers continue to replace our residential voice services with wireless voice services. In addition, new entrants with significant financial resources may compete on a larger scale with our video and data services, and as more wireless voice service providers offer unlimited data options, some customers may choose to forgo our data services altogether. […] Historically, we have focused on retaining customers who are likely to produce higher relative value over the life of their service relationship with us, are less attracted to discounting, require less support and churn less. However, in response to increasing competition in our markets, we are also seeking to supplement our growth by targeting a broader scope of incremental customers, including those who are more value-conscious, through more targeted pricing and product offerings. While these efforts are intended to grow our customer base, they may adversely impact the ARPU and profit margins of our residential data services and lead to increased average churn rates for our residential data customers.
p. 40 · Read in context →
More peer documents
Q2_FY2025 — 14 pages · CEO Sievert says he is 'decreasingly interested' in cable, calls fiber/FWA a superior product, and sizes the opportunity at ~45 million home-passings-equivalent — direct strategy collision with Charter's broadband base. · Open →
Q1_FY2026 — 12 pages · Stankey details the AT&T OneConnect single fiber-plus-wireless subscription and ~45% converged rate — the productized convergence bundle attacking Charter's own converged offer. · Open →
Q4_FY2025 — 12 pages · CFO Koetje details head-to-head competition against both FWA and fiber and tracking small regional overbuilders 'by the neighborhood'; CEO cites Comcast and Charter's mobile experience as the template for Cable ONE's own convergence launch. · Open →
CMCSA_annual_report_FY2025 — 167 pages · 10-K Competition prose describing fixed-wireless and fiber overbuilders as threats to the connectivity business — the shared-threat framing in cable-peer filing language. · Open →
Source: S&P Capital IQ consensus via Xpressfeed · Generated 2026-07-25.
Charter's consensus tape describes a business at a plateau: analysts model revenue stuck near $54B and EBITDA flat around $22B through 2029, with estimates trimmed roughly 3-4% over the past six months. The forward story is cash, not growth: as capex rolls off from about $11.5B toward $8B, free cash flow climbs above $7B by 2028 and net debt falls from ~$95B toward ~$81B. Normalized EPS still rises from $36 in 2025 into the mid-$40s even as the operating base flattens. The Street is unconvinced, with a hold-heavy rating book and a $110-$413 target range framing an unusually wide bull-bear debate.
Forward estimates
Currency: USD · Scale: money in millions, absolute · YoY uses the prior fiscal year from the feed; analyst count and range use the first displayed period.
| Metric | FY2025A | FY2026E | FY2027E | FY2028E | FY2029E | YoY | Analysts | Low / high |
|---|---|---|---|---|---|---|---|---|
| Revenue | $54.91bn | $54.28bn | $53.74bn | $53.84bn | $53.89bn | — | 19 | $54.84bn / $55.05bn |
| EBITDA | $22.52bn | $22.32bn | $22.05bn | $22.01bn | $21.74bn | — | 19 | $21.53bn / $22.67bn |
| Capital expenditure | -$11.50bn | -$11.45bn | -$9.54bn | -$8.12bn | -$8.21bn | — | — | — |
| Free cash flow | $4.99bn | $4.86bn | $6.13bn | $7.30bn | $6.38bn | — | — | — |
| Net debt | $95.24bn | $93.32bn | $90.08bn | $86.69bn | $80.96bn | — | — | — |
| EPS (normalized) | $35.92 | $43.26 | $45.02 | $46.17 | $40.82 | — | 16 | $33.95 / $39.25 |
Both revenue and EPS estimates were cut since January; FY2028 revenue is down ~4% in six months
The downgrades concentrate in the outer year: the 180-day cut runs about 3% for FY2027 revenue and 4% for FY2028, with normalized EPS trimmed alongside it.
Currency: USD · Scale: money in millions, absolute · Point-in-time consensus; Δ90d is Now versus 90d.
| Metric | FY | 180d | 90d | 30d | Now | Δ90d |
|---|---|---|---|---|---|---|
| Revenue | FY2027 | $55.30bn | $54.27bn | $53.90bn | $53.74bn | -1.0% |
| Revenue | FY2028 | $56.24bn | $54.65bn | $54.12bn | $53.84bn | -1.5% |
| EPS (normalized) | FY2027 | $47.37 | $45.12 | $44.67 | $45.02 | -0.2% |
| EPS (normalized) | FY2028 | $46.51 | $47.78 | $47.17 | $46.17 | -3.4% |
Revenue prints land within 1% of consensus every quarter while normalized EPS swings from +10% to -10%
Current sequences by metric: Revenue: 2 consecutive beats; EPS (normalized): 1 consecutive beat.
Currency: USD · Scale: money in millions, absolute · Consensus is captured before each actual first became effective.
| Quarter | Metric | Consensus | Actual | Surprise | Outcome |
|---|---|---|---|---|---|
| Q2 FY2026 | Revenue | $13.51bn | $13.53bn | +0.1% | Beat |
| Q2 FY2026 | EPS (normalized) | $10.41 | $10.66 | +2.4% | Beat |
| Q1 FY2026 | Revenue | $13.54bn | $13.60bn | +0.4% | Beat |
| Q1 FY2026 | EPS (normalized) | $10.07 | $9.17 | -9.0% | Miss |
| Q4 FY2025 | Revenue | $13.73bn | $13.60bn | -1.0% | Miss |
| Q4 FY2025 | EPS (normalized) | $9.83 | $10.34 | +5.2% | Beat |
| Q3 FY2025 | Revenue | $13.75bn | $13.67bn | -0.6% | Miss |
| Q3 FY2025 | EPS (normalized) | $9.32 | $8.34 | -10.5% | Miss |
| Q2 FY2025 | Revenue | $13.76bn | $13.77bn | +0.0% | Beat |
| Q2 FY2025 | EPS (normalized) | $9.77 | $9.18 | -6.1% | Miss |
| Q1 FY2025 | Revenue | $13.67bn | $13.73bn | +0.5% | Beat |
| Q1 FY2025 | EPS (normalized) | $8.59 | $8.42 | -2.0% | Miss |
| Q4 FY2024 | Revenue | $13.88bn | $13.93bn | +0.3% | Beat |
| Q4 FY2024 | EPS (normalized) | $9.17 | $10.10 | +10.2% | Beat |
| Q3 FY2024 | Revenue | $13.66bn | $13.79bn | +1.0% | Beat |
| Q3 FY2024 | EPS (normalized) | $8.49 | $8.82 | +3.9% | Beat |
Analysts split hard on out-year earnings: FY2028 normalized EPS spans $34 to $55
Revenue coverage is tight, but earnings dispersion widens down the income statement and into the outer years. FY2027 net income (GAAP) already ranges from $4.0B to $6.3B across ten analysts.
Currency: USD · Scale: money in millions, absolute · Spread/mean is absolute high-low divided by absolute mean.
| Metric | Period | Mean | Low–high | Spread/mean | Analysts |
|---|---|---|---|---|---|
| EPS (normalized) | FY2027E | $45.02 | $36.25–$49.60 | 29.7% | 9 |
| EPS (normalized) | FY2028E | $46.17 | $34.21–$55.13 | 45.3% | 7 |
| Net income (GAAP) | FY2027E | $5.04bn | $4.01bn–$6.25bn | 44.6% | 10 |
Street snapshot
Currency: USD · Scale: money in millions, absolute · Analyst counts shown explicitly.
| Street view | Reading | Analysts |
|---|---|---|
| Recommendation mix | Buy 5, Outperform 0, Hold 11, Underperform 2, Sell 3 | 21 |
| Consensus score | 2.90 | 21 |
| Target price | mean $208.5; median $190.0; high $413.0; low $110.0 | 17 |
FY2029 coverage is thin, so treat outer-year lines as directional
Only a handful of analysts carry FY2029: revenue (4), EBITDA (5) and normalized EPS (4). The wide 2029 EPS range of $27.5 to $49.2 reflects sparse coverage as much as genuine disagreement.
Visible Alpha broker models via S&P Xpressfeed · 19 brokers · 441 line items · freshest revision 2026-07-25.
Broker models frame Charter as a business trading near-flat revenue for a sharp free-cash-flow inflection: as the rural-buildout capex cliff arrives, modeled PP&E spend falls from ~$11.5bn toward ~$7.7bn by FY-2028 and company-defined FCF per share nearly triples, from ~$35 to ~$102, amplified by an assumed drop in diluted shares from ~141m to ~72m. The top line stays roughly flat near $54bn as fast-growing mobile service revenue offsets steady erosion in residential internet and video. The live debate is in the volume lines — how deep broadband losses run and how durable mobile-line growth proves — and in how quickly capex actually normalizes. Forward coverage is thin: most FY-2027/28 lines rest on only three to four brokers.
The capex cliff: FCF per share nearly triples to ~$102 by FY-2028
Models have PP&E capex falling from ~$11.5bn to ~$7.7bn as line-extension spend more than halves, lifting company-defined FCF; a large cut to diluted shares does the rest. The forward path rests on just two to three brokers.
| Line | FY-2025A | FY-2026E | FY-2027E | FY-2028E | YoY | Brokers |
|---|---|---|---|---|---|---|
| Capex | — | — | — | — | — | — |
| Purchases of property, plant and equipment | $11.51bn | $11.41bn | $9.45bn | $7.69bn | -0.8% | 17 |
| Line extensions- Capex | $4.01bn | $3.26bn | $2.44bn | $1.96bn | -18.6% | 15 |
| Cash flow | — | — | — | — | — | — |
| Free cash flow - Company defined | $4.90bn | $4.80bn | $5.66bn | $7.62bn | -1.9% | 17 |
| Free Cash flow per share - Company defined($) | $35.07 | $39.41 | $55.37 | $102.2 | +12.4% | 17 |
| Per share | — | — | — | — | — | — |
| Weighted average shares outstanding - Diluted(M#) | 141.11m Number | 121.84m Number | 102.04m Number | 72.03m Number | -13.7% | 19 |
| EPS-Diluted($) | $35.26 | $39.95 | $45.41 | $62.42 | +13.3% | 19 |
Key drivers
| Line | FY-2025A | FY-2026E | FY-2027E | FY-2028E | YoY | Brokers |
|---|---|---|---|---|---|---|
| Growth engine | — | — | — | — | — | — |
| Residential - Mobile service revenue | $3.80bn | $4.34bn | $4.92bn | $5.47bn | +14.5% | 18 |
| Legacy decline | — | — | — | — | — | — |
| Residential - Internet revenue | $23.79bn | $23.22bn | $22.72bn | $22.25bn | -2.4% | 18 |
| Residential - Video revenue | $13.79bn | $12.65bn | $12.13bn | $11.72bn | -8.3% | 18 |
| Steady | — | — | — | — | — | — |
| Commercial revenue | $7.33bn | $7.38bn | $7.41bn | $7.44bn | +0.7% | 18 |
| Consolidated | — | — | — | — | — | — |
| Total revenue | $54.91bn | $54.26bn | $53.69bn | $53.70bn | -1.2% | 19 |
Broadband subscribers keep shrinking as mobile lines grow — but mobile adds are slowing
| Line | FY-2025A | FY-2026E | FY-2027E | FY-2028E | YoY | Brokers |
|---|---|---|---|---|---|---|
| Broadband | — | — | — | — | — | — |
| Total internet subscribers(K#) | 29.66m Number | 29.09m Number | 28.47m Number | 27.80m Number | -1.9% | 17 |
| Internet - net adds(K#) | -416,437 Number | -588,125 Number | -615,100 Number | -671,439 Number | -41.2% | 17 |
| Mobile | — | — | — | — | — | — |
| Total mobile lines(K#) | 11.87m Number | 13.35m Number | 14.78m Number | 16.11m Number | +12.4% | 13 |
| Mobile lines - net adds(K#) | 1.99m Number | 1.58m Number | 1.43m Number | 1.34m Number | -20.6% | 14 |
| Video | — | — | — | — | — | — |
| Video - net adds(K#) | -409,501 Number | -198,000 Number | -179,000 Number | -161,250 Number | +51.6% | 17 |
Where the models split: capex pace, resulting FCF, and how bad broadband gets
| Line | Period | Median | Q1–Q3 | Min–max | Brokers |
|---|---|---|---|---|---|
| Cable Capex | FY-2028E | $7.48bn | $7.39bn–$8.30bn | $7.26bn–$10.59bn | 4 |
| Free cash flow - Company defined | FY-2028E | $8.04bn | $7.32bn–$8.12bn | $6.61bn–$8.20bn | 3 |
| Internet - net adds(K#) | FY-2028E | -667,750 Number | -791,125 Number–-548,064 Number | -820,000 Number–-530,255 Number | 4 |
| Total mobile lines(K#) | FY-2028E | 16.13m Number | 16.04m Number–16.21m Number | 15.84m Number–16.35m Number | 4 |
Forward coverage thins to a handful of brokers
Current-year (FY-2025) lines carry roughly 15-19 brokers, but most FY-2027 and FY-2028 estimates rest on only three to four, and several mobile and segment detail lines on a single broker. Revisions are current (July 2026), so the risk here is dispersion, not staleness; single-broker lines are one analyst's view, not consensus.
Headline P&L consensus, momentum and beat/miss live in the CapIQ tab.
Source: S&P Capital IQ transcripts via Xpressfeed · latest indexed call 2026-07-24 · generated 2026-07-25.
Latest call digest
Charter Communications, Inc., Q2 2026 Earnings Call, Jul 24, 2026 · 2026-07-24T12:00:00
Q2 2026 call — July 24, 2026. The prepared remarks led with the wins: over 400,000 Spectrum Mobile lines added (16% growth, now over 12.5 million lines) and a video customer loss of just 21,000. But the headline of the quarter was financial, not operational. Management lowered its post-transaction leverage target to a flat 3.5x, launched a capped exchange offer targeting $20 billion of investment-grade debt, and paused buybacks through the third quarter with a restart expected in the fourth. The Cox close was pushed to mid- to late August.
The Q&A surfaced the softer reality the script glided over. Internet customer losses of 172,000 were higher than a year ago, and management cut its full-year standalone EBITDA outlook to a decline of around 1% (ex-transition) versus the slight growth guided in January. CEO Chris Winfrey openly owned an aggressive first-half retention push that pressured ARPU without delivering the sales it was meant to. Much of the analyst time went to wireless — offload rates, the Verizon and T-Mobile MVNOs, and whether Charter should help build or fund a fourth wireless network — where management held firmly to its capital-light stance. The through-line: management increasingly anchors the bull case on the mechanical free-cash-flow ramp rather than a near-term broadband turn, whose timing it now calls hard to predict.
Participant coverage from the latest call.
| Group | Participants | Count |
|---|---|---|
| Management | Operator; Stefan Anninger — Vice President of Investor Relations, Charter Communications, Inc.; Christopher Winfrey — President, CEO & Director, Charter Communications, Inc.; Jessica Fischer — Chief Financial Officer, Charter Communications, Inc. | 4 |
| Analysts | Craig Moffett — Co-Founder, Founding Partner Senior Managing Director & Senior Research Analyst, MoffettNathanson LLC; Vikash Harlalka — Director on the US Communications Services Team & Lead Analyst, New Street Research LLP; Steven Cahall — Senior Analyst, Wells Fargo Securities, LLC, Research Division; Walter Piecyk — Partner & TMT Analyst, LightShed Partners, LLC | 4 |
Curated latest-call exchanges; one row per analyst topic.
| Analyst | Firm | Topic | What changed in Q&A |
|---|---|---|---|
| Craig Moffett | MoffettNathanson | Broadband ARPU outlook and wireless offload | Pressed on the earlier positive-broadband-ARPU-for-the-year guide; CFO said broadband ARPU improves sequentially in Q3 after aggressive 1H retention offers largely normalized, and reiterated that the company manages to customer-relationship ARPU rather than product ARPU. |
| Vikash Harlalka | New Street Research | Lowered EBITDA outlook and a Starlink partnership rumor | Asked what changed in the first six months to lower the EBITDA target; management cited offers that underdelivered on sales plus controllable-cost pressure in fuel and medical, and declined to detail any Starlink conversation. |
| Steven Cahall | Wells Fargo | Wireless build/partnership and Cox internet trends | Management stayed capital-light on any network build and said Cox's subscriber and revenue trends run a couple of clicks below Spectrum's, with no change to the acquisition playbook. |
| Walter Piecyk | LightShed Partners | Putting capital behind a wireless network build | Pushed on whether joining a build for the last ~12% of traffic makes sense; management said there are no such plans and pointed to potential off-balance-sheet structures rather than changing its capital trajectory. |
Theme tracker
Themes are curator-classified across supplied calls.
| Theme | Status | Quarters mentioned | Read-through |
|---|---|---|---|
| Spectrum Mobile growth and convergence as the churn lever | persisted | Q3 2023, Q4 2023, Q1 2024, Q2 2024, Q3 2024, Q4 2024, Q1 2025, Q2 2025, Q3 2025, Q4 2025, Q1 2026, Q2 2026 | Roughly 400,000-plus mobile line adds have anchored every call, with management consistently framing mobile attach as the main tool to reduce broadband churn and defend the relationship. |
| Broadband subscriber pressure from fiber, fixed wireless and a soft housing/move environment | persisted | Q3 2023, Q4 2023, Q1 2024, Q2 2024, Q3 2024, Q4 2024, Q1 2025, Q2 2025, Q3 2025, Q4 2025, Q1 2026, Q2 2026 | The competitive and macro backdrop has been a fixture; over the most recent calls management narrowed the diagnosis to top-of-funnel gross-add softness rather than churn, which sits at historic lows. |
| Cox acquisition, integration and ARPU migration playbook | emerged | Q2 2025, Q3 2025, Q4 2025, Q1 2026, Q2 2026 | Since the deal, Cox has become a recurring focus — regulatory timing (California PUC), synergy sizing (at least $800 million), and the plan to migrate Cox customers to lower Spectrum pricing while lifting mobile and video penetration. Close slipped from a targeted summer to mid- to late August. |
| Free-cash-flow ramp from a capital-expenditure step-down | persisted | Q3 2023, Q4 2023, Q1 2024, Q2 2024, Q3 2024, Q4 2024, Q1 2025, Q2 2025, Q3 2025, Q4 2025, Q1 2026, Q2 2026 | As network evolution and rural build wind down, management has repeatedly pointed to run-rate capex falling below $8 billion and a resulting free-cash-flow ramp; this has become the central pillar of the bull case as subscriber growth lagged. |
| Video turnaround via seamless entertainment and programmer app inclusion | persisted | Q3 2023, Q4 2023, Q1 2024, Q2 2024, Q3 2024, Q4 2024, Q1 2025, Q2 2025, Q3 2025, Q4 2025, Q1 2026, Q2 2026 | Video has featured every call, but the narrative flipped from steep losses to sharply improving trends after the late-2024 pricing/packaging and app-inclusion moves; management frames video primarily as a broadband-retention tool, not a net-add goal. |
| Lower-leverage pivot and capital-structure management | emerged | Q4 2025, Q1 2026, Q2 2026 | Management progressively ratcheted the post-transaction leverage target down after citing shareholder and bondholder preference for less leverage in a lower-growth period, culminating in a flat 3.5x target and a debt exchange offer in Q2 2026. |
| AI in customer service and cost-to-serve | emerged | Q3 2025, Q4 2025, Q1 2026, Q2 2026 | Building on a long-running cost-to-serve efficiency story, management elevated AI — including Agentic AI — as a distinct future cost and service lever, describing early benefits ramping while flagging the larger impact as still 12 to 18 months out. |
| Affordable Connectivity Program (ACP) disruption | dropped | Q3 2023, Q4 2023, Q1 2024, Q2 2024, Q3 2024, Q4 2024, Q1 2025, Q2 2025, Q3 2025, Q4 2025 | ACP was central to the 2024 subscriber narrative and was still cited as a year-over-year churn comparison through 4Q 2025, but it is not mentioned on the 1Q or 2Q 2026 calls, indicating the disruption has fully lapped. |
Guidance ledger
Quotes, calls, and speakers are source-verified; outcomes are curator-classified.
| Verbatim guidance | Call | Speaker | Curator outcome | Outcome note |
|---|---|---|---|---|
| “We expect 2025 full year EBITDA growth to be flat or marginally positive year-over-year with higher underlying growth absent the impact of political advertising.” | Charter Communications, Inc., Q3 2025 Earnings Call, Oct 31, 2025 · 2025-10-31T12:30:00 | Jessica Fischer | kept | On the 4Q 2025 call management reported full-year 2025 EBITDA grew by 0.6%, consistent with flat-to-marginally-positive. |
| “We expect total 2026 capital expenditures to reach $11.4 billion.” | Charter Communications, Inc., Q4 2025 Earnings Call, Jan 30, 2026 · 2026-01-30T13:30:00 | Jessica Fischer | pending | Reaffirmed at approximately $11.4 billion on both the 1Q and 2Q 2026 calls; full-year result not yet reported. |
| “For the full year 2026, we are planning for slight EBITDA growth, excluding the impact of transition costs.” | Charter Communications, Inc., Q4 2025 Earnings Call, Jan 30, 2026 · 2026-01-30T13:30:00 | Jessica Fischer | missed | By the 2Q 2026 call management lowered the standalone FY2026 outlook to a decline of around 1% excluding transition costs, reversing the earlier slight-growth plan. |
| “Ultimately, I think we expect Internet ARPU to grow this year, though more slowly than it has in prior years as we drive Spectrum pricing and packaging through the footprint.” | Charter Communications, Inc., Q4 2025 Earnings Call, Jan 30, 2026 · 2026-01-30T13:30:00 | Jessica Fischer | pending | In 1Q 2026 management called full-year internet ARPU growth 'close either way'; in 2Q 2026 the CFO said broadband ARPU would only improve sequentially in Q3 after aggressive first-half retention offers pressured it. |
| “we're moving our post-transaction leverage target to a flat 3.5x, which we expect to achieve within 3 years following the close of the Cox and Liberty Broadband transactions” | Charter Communications, Inc., Q2 2026 Earnings Call, Jul 24, 2026 · 2026-07-24T12:00:00 | Christopher Winfrey | pending | Latest in a successive tightening of the target (from a 4-4.5x history, to 3.5-4x at the Cox announcement, to the low end of 3.5-3.75x in 1Q 2026); the three-year clock starts at deal close, which had not yet occurred. |
| “our run rate capital expenditures for standalone Charter would be below $8 billion per year” | Charter Communications, Inc., Q2 2026 Earnings Call, Jul 24, 2026 · 2026-07-24T12:00:00 | Jessica Fischer | pending | A standalone run-rate target for after the network evolution and expansion initiatives conclude (around 2028); consistent with prior calls and not yet due. |
Q&A pressure map
Question counts and firms are curator tallies; analyst coverage shown above.
| Topic | Questions | Firms | Pressure / response |
|---|---|---|---|
| Broadband subscriber trajectory and new competition (fiber, fixed wireless, satellite) | 6 | MoffettNathanson, Morgan Stanley, New Street Research, Wells Fargo, UBS | The most persistent line of questioning across the Q3 2025-Q2 2026 calls: when broadband returns to growth and how fiber, cell-phone internet and LEO satellite are affecting the funnel. Management repeatedly framed the issue as top-of-funnel gross-add softness with churn at lows. |
| Cox acquisition — ARPU migration, synergies and further M&A | 5 | BofA, Raymond James, Morgan Stanley, MoffettNathanson, Wells Fargo | Analysts pressed on how quickly Cox's higher broadband ARPU can be migrated to lower Spectrum pricing without eroding household economics, the path of synergies, and appetite for additional cable consolidation. |
| Pricing and ARPU strategy | 6 | New Street Research, Citigroup, Raymond James, JPMorgan, MoffettNathanson | Recurring questions on price locks, everyday-value versus promotional pricing, and whether ARPU can accelerate; management held its low-price, high-penetration philosophy and declined to commit to a broadband price increase. |
| Wireless offload, CBRS and whether to build or fund a network | 5 | MoffettNathanson, Wells Fargo, LightShed Partners | Pressure concentrated on the 2Q 2026 call around offload rates and a potential fourth wireless network. Management engaged the offload mechanics but sidestepped the specific Starlink-partnership rumor, saying only that it would not detail such conversations. |
| EBITDA growth outlook | 4 | Morgan Stanley, New Street Research, JPMorgan | Analysts repeatedly probed how close to the line full-year EBITDA growth would be and how much leaned on political advertising; the commitment softened over the four calls and was ultimately cut to a decline in 2Q 2026. |
Language shifts
Only language evidence verified against the referenced component is shown.
| Observation | Verbatim evidence | Call ID | Component |
|---|---|---|---|
| Management shifted the emphasis of the bull case from a near-term broadband turn toward the mechanical certainty of the free-cash-flow ramp, conceding the subscriber recovery is hard to time. | “The timing of all that is hard to predict, but our cash flow growth is not, and we have full confidence in the significant free cash flow ramp we're about to see.” | 2008048266 | 2 |
| Unusually direct CEO ownership of a misstep — the aggressive first-half retention push that pressured ARPU — a more candid register than the confident tone of prior calls. | “So we pulled back. I own that.” | 2008048266 | 7 |
| The 'game of inches' framing entered the vocabulary in Q4 2025 to characterize how small the gap is between net losses and net adds, signaling caution on the pace of any recovery. | “getting back to positive net additions is a game of inches” | 1974724673 | 2 |
| The 'top-of-the-funnel softness' phrasing persisted into 2026 as the standardized way of describing the broadband weakness — gross adds, not churn. | “we have been facing top-of-the-funnel softness” | 2008048266 | 3 |
| Language on satellite hardened from the earlier 'more friend than foe' posture to explicitly naming Starlink and stating they take it seriously, even while reporting no meaningful share loss. | “so far, we haven't observed meaningful share loss to Starlink, including in our subsidized rural footprint, but we continue to monitor it closely and take it seriously” | 2008048266 | 3 |
Across the last eight quarters the story has drifted in one direction: management has steadily de-emphasized a near-term return to broadband growth and leaned harder on the capex-driven free-cash-flow ramp, the Cox integration and delevering as the value case. The 2Q 2026 call crystallized that trade — internet losses widened, the full-year EBITDA outlook was cut from slight growth to a modest decline, and the CEO owned a retention misstep — even as the balance-sheet and cash-flow narrative grew more assertive. The investment debate now hinges on whether the mechanical cash-flow ramp and Cox accretion arrive before the broadband franchise turns.